semi合集-English.pdf - 第4144页
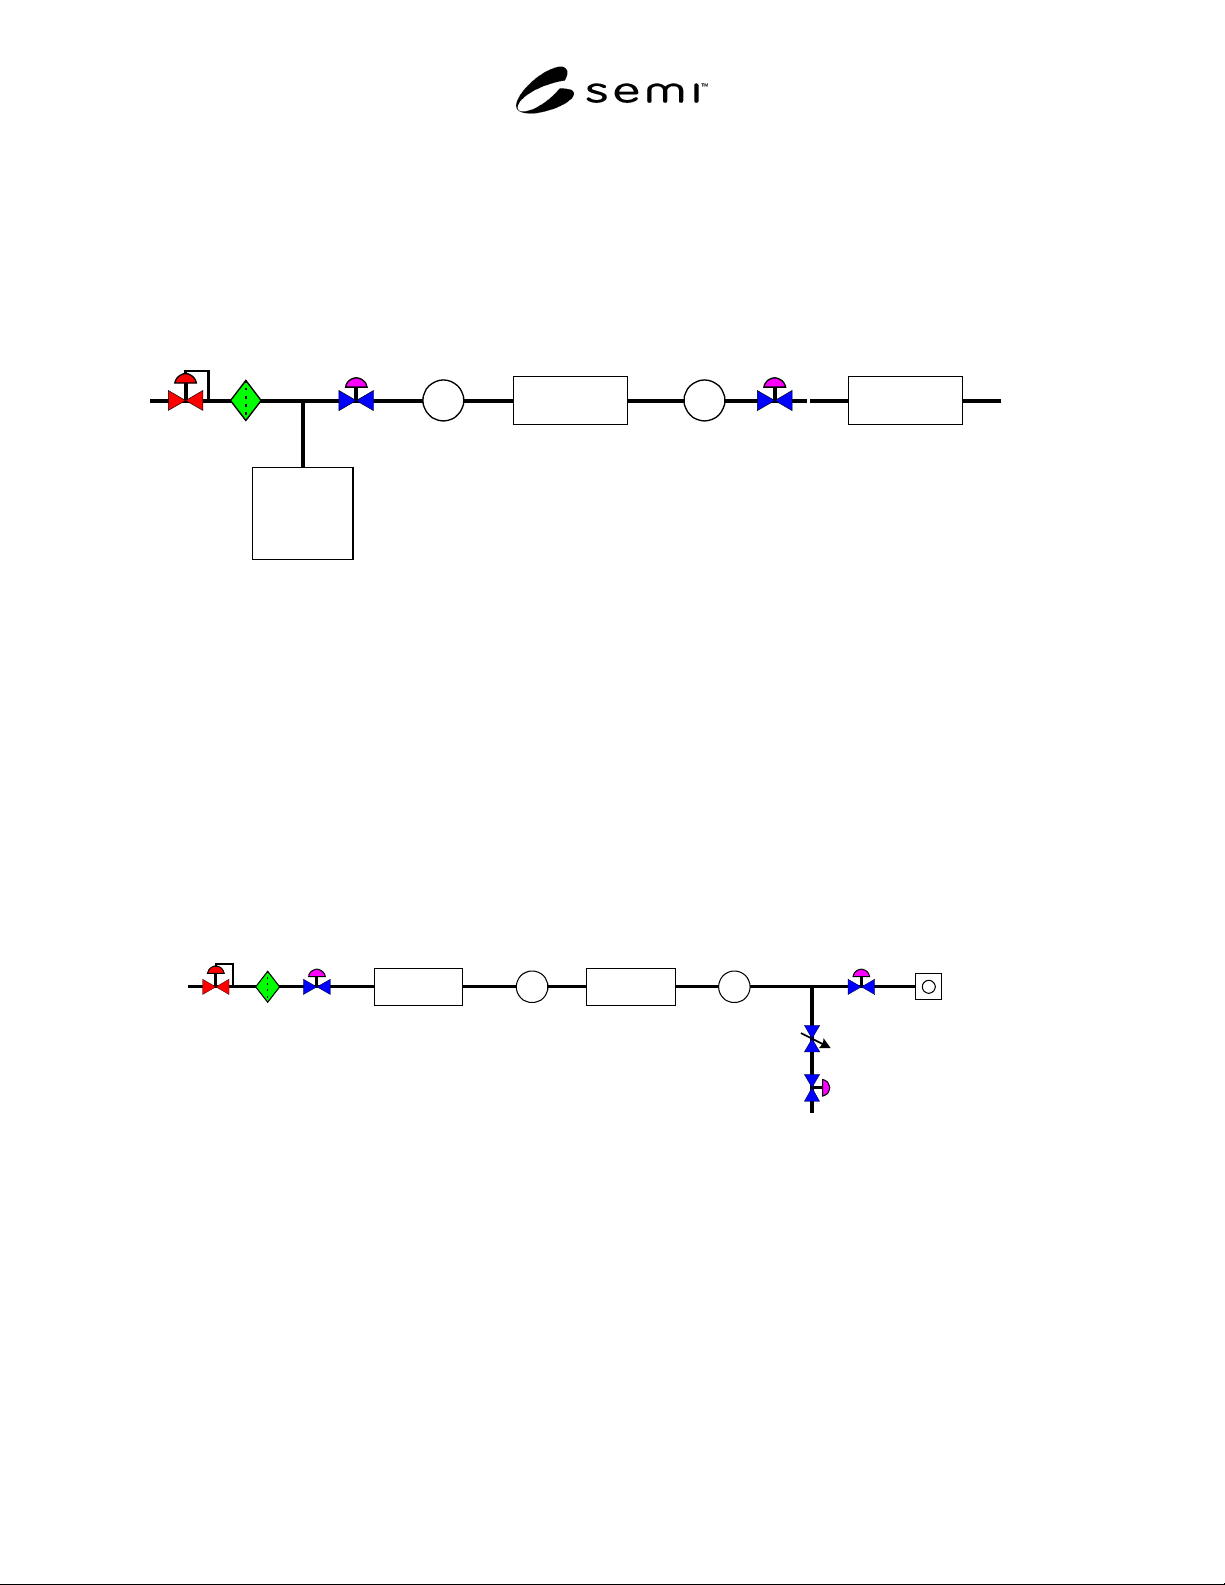
SEMI F64-0701 © SEMI 2001 6 17 Illustrations Flow Standard P DUT P Vio P2 P1 Vii Pressure Control Device Figure 1 Test Sch ematic for Methods A, A 1 , A 2 , and B Flow Standard P DUT P Pump Vip MV Vio Vent P2 P1 Vii Figu…

SEMI F64-0701 © SEMI 20015
14.4.6 Open V
io
and adjust the meteri ng valve, MV,
until P
2
= 101.325 kPa.
14.4.7 Allow Q
I
to reach stability. Re cord P
1
, Q
I
, and
Q
A
(see Table A3).
14.4.8 Close V
io
. P
2
should = 26.664 kPa.
14.4.9 Allow Q
I
to reach stability. Re cord P
1
, Q
I
, and
Q
A
(see Table A3).
14.4.10 Give the DUT a 100% set point and repeat
Sections 14.4.5 through 14.4.9.
14.5 Crosstalk Pressure Effect (Me thod D)
14.5.1 Assemble the DUT in the test apparatus (see
Figure 10).
14.5.2 Satisfy the manufacturer’s war m-up
requirements for the DUT.
14.5.3 Set the inlet pressure (P
1
) to 274 kPa (25 psig)
14.5.4 Give the DUT a 100% set point (Q
SP
= Q
FS
).
14.5.5 Give the 10× MFC a 100% set point (Q
SP
=
Q
FS
).
14.5.6 Wait until the DUT and MFC achieve stability.
14.5.7 Record P
1
, P
2
, the indicated flo w from the
DUT, the indicated flow from the MFC and the
indicated flow from the flow standard continuously
with the data acquisition system.
14.5.8 While monitoring command the 10 × MFC to a
zero set-point. Wait until the DUT becomes stable then
command the 10× MFC to a 100% set Point.
14.5.9 Sample Plot is shown in Figur e 11.
15 Calculations or Interpreta tion of Results
15.1 See Appendix 1 for detailed information on data
collection and interpretation for Methods A-1, A-2, B,
and C.
15.2 Calculations — The indicated MFC flow output
data and the flow standard output data should be
converted to percent of full scale flow as follows:
100 x
(v)output scale full
(v) dataoutput
= flow scale full of %
(1)
15.3 Interpretation — Collect the following data and
report as an effect of transient pressure conditions:
15.4 Plot of indicated flow, actual flow, and flow set
point versus time.
15.5 Duration of instability. Maximum and minimum
deviations from the steady state actual and indicated
flows. Calculate the positive and negative integrals,
along with the total integral of variations in the actual
and indicated flows.
15.6 Inlet (P
1
) and outlet (P
2
) values.
15.7 The number of repetitions required to achieve a
confidence factor of 95% for each test step.
15.8 Data plots for the measured va lues must be
generated and presented in a manner similar to that
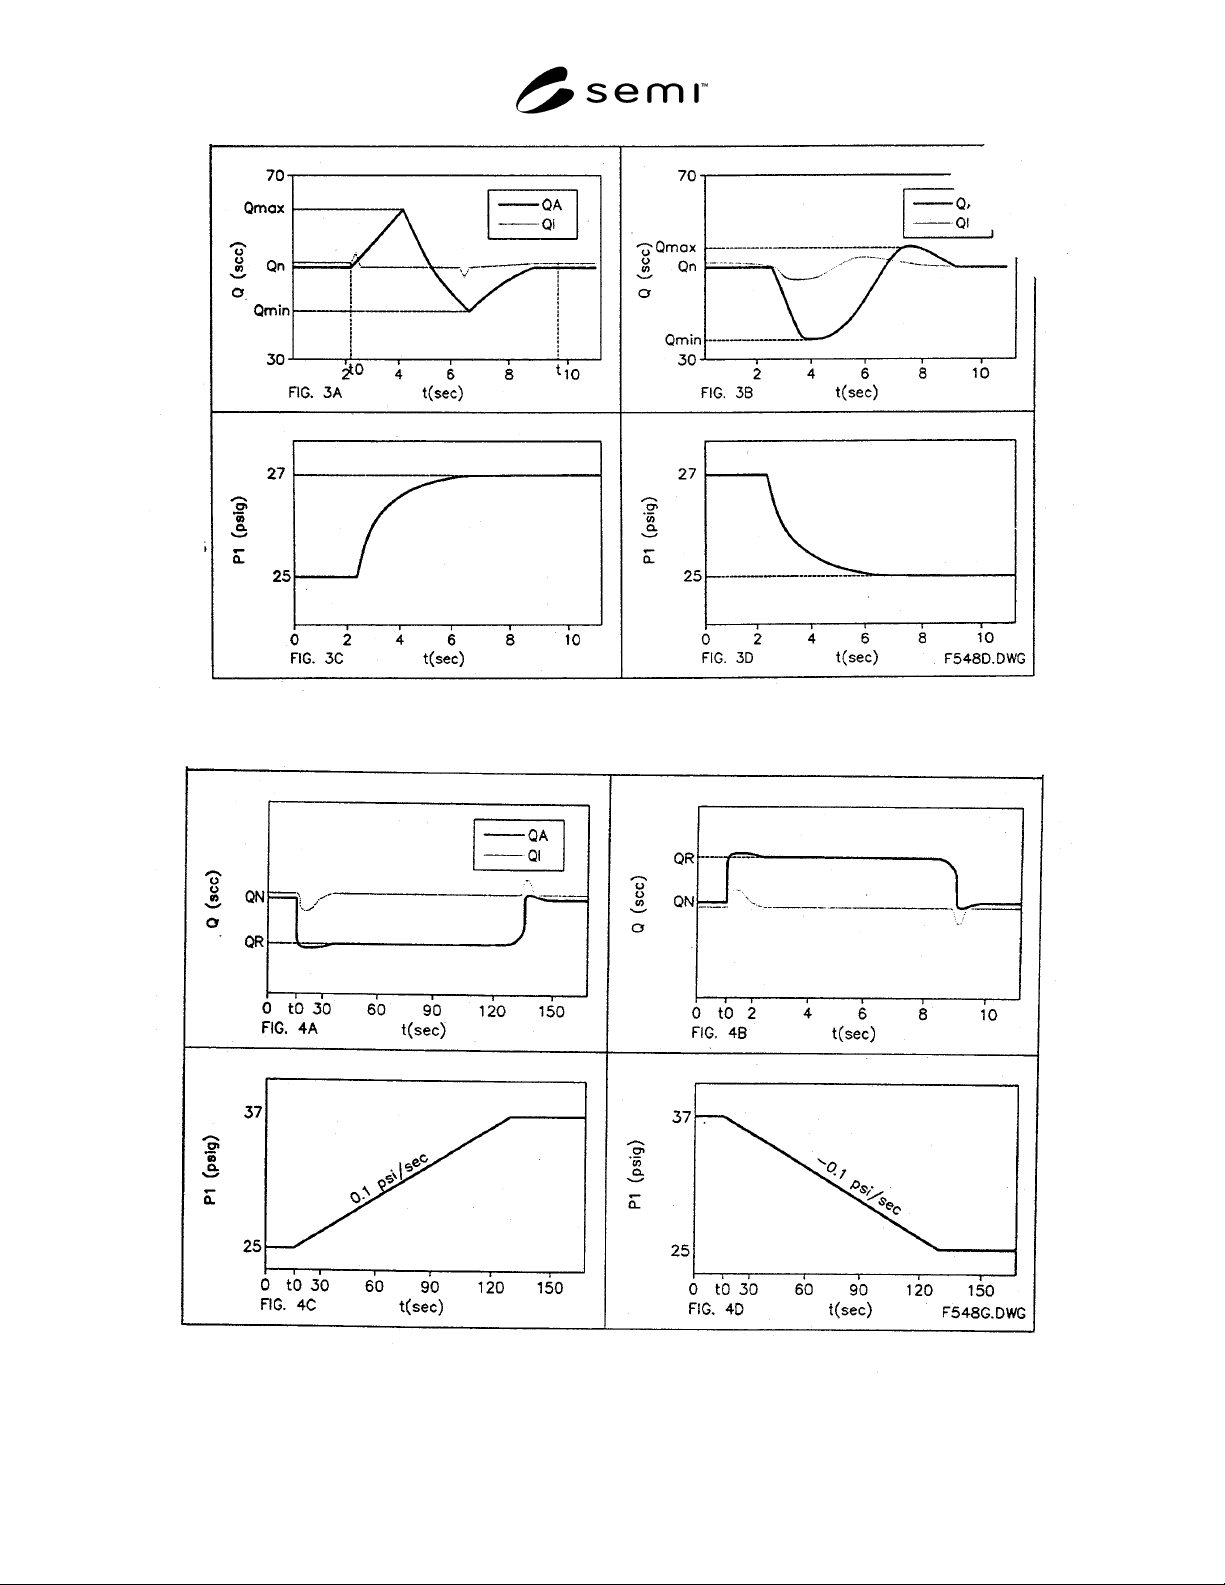
shown in Figures 3, 4, and 5 and in Table 1.
16 Related Documents
16.1 Military Standards
1
MIL-STD 45662 Calibration Systems Requirements
1 Naval Publication and Forms Center, 5801 Tabor Avenue,
Philadelphia PA 19120 U.S.A
SEMI F64-0701 © SEMI 2001 6
17 Illustrations
Flow
Standard
P
DUT
P
Vio
P2
P1
Vii
Pressure
Control
Device
Figure 1
Test Schematic for Methods A, A
1
, A
2
, and B
Flow
Standard
P
DUT
P
Pump
Vip
MV
Vio
Vent
P2
P1
Vii
Figure 2
Test Schematic for Method C
SEMI F64-0701 © SEMI 20017
Figure 3
Q and P
1
versus t: Data Presentation for Method A-1 (see Appendix 1)
Figure 4
Q and P
1
versus t: Data Presentation for Method A-2 (see Appendix 1)