semi合集-English.pdf - 第5417页
SEMI M58-0704 © SEMI 2004 10 R2-3.5 Interpretation of Resu lts R2-3.5.1 A conditional command is used to automatically grad e results for Uncertainty and FWHM. R2-3.5.1.1 The equation for Bottle B Uncertain ty (row 50) i…

SEMI M58-0704 © SEMI 2004 9
RELATED INFORMATION 2
EXAMPLE OF A COMPLETED DATA AND ANALYSIS SHEET
NOTICE: This related information is not an official part of SEMI M58 and was derived from information
developed during drafting of the standard. This related information was approved for publication by full letter ballot
procedures on April 22, 2004.
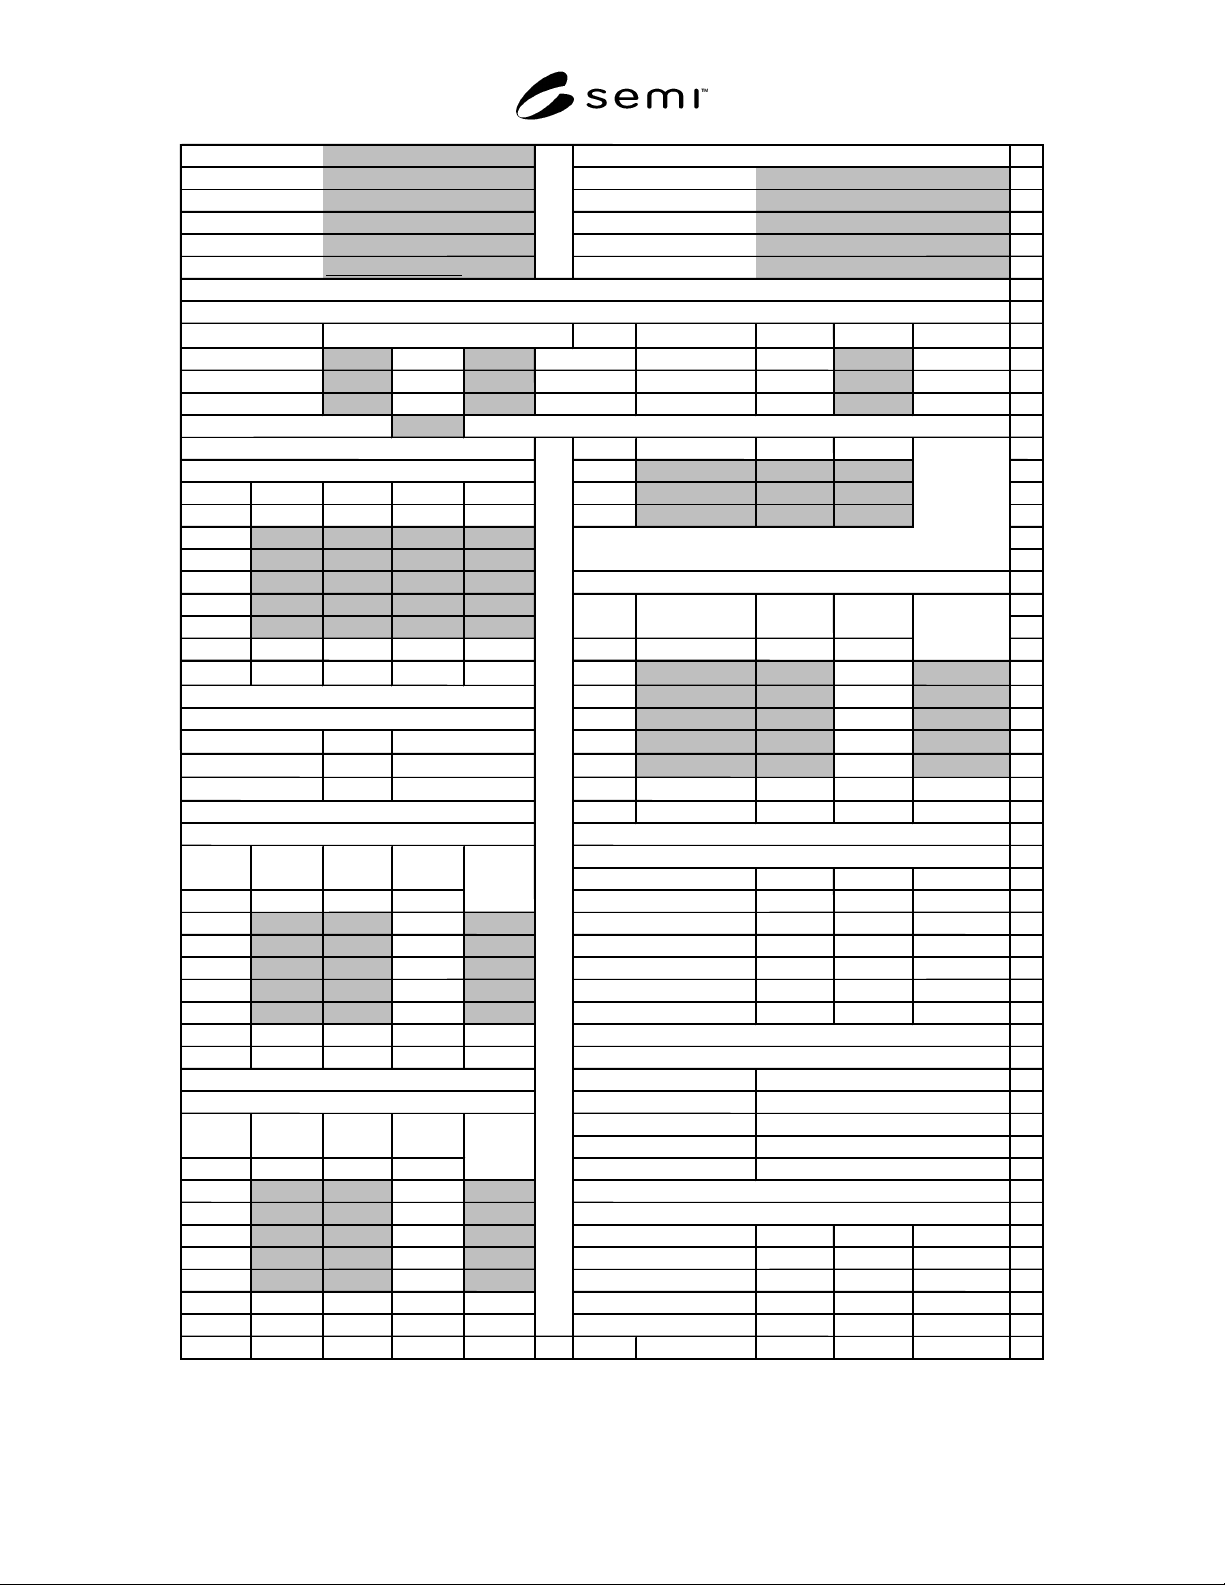
R2-1 Figure R2-1 shows an example of a completed
data set. This example is the result of using a
spreadsheet that automates the calculations of Section
11. If such a spreadsheet is constructed, once the data
is input as described in Section 10 the results of the test
are found by spreadsheet calculation.
R2-2 In this example the results obtained indicate that
the deposition system is capable of meeting the
requirements of SEMI M52 for all three bottles. Note
that the test was done with an SSIS that was not
calibrated according to SEMI M53.
R2-3 The following sections detail the spreadsheet
example in Figure R2-1 in order to allow it to be easily
duplicated for use with this test method. Information in
the shaded cells is entered in accordance with the
procedures given in Section 10.
R2-3.1 At the top of the spreadsheet, the entries in
rows 1 through 13 are obvious except for those in cells
H10 through H12. Here, the uncertainties on the bottle
are converted to %. In this example, Bottle C does not
have a peak diameter uncertainty given. This is true for
many older bottles where diameters were given in terms
of mean, rather than peak, diameters. To avoid
returning an error result, the formula for the percentage
is =IF(SUM(Ei>0,Ei/Ci," not available" ), where i = 10,
11, or 12 for Bottle A, B, or C, respectively. The cell is
formatted for % with one decimal place.
R2-3.2 In the section on Deposition System Diameters
and the three SSIS Data sections the inputs are taken
directly from the instrumentation as directed in Section
10. As an example, the equation to compute mean in
B23 is: =AVERAGE(B18:B22). The equation to
compute s
Dep
in B24 is: =STDEV(B18:B22)/B23 and is
formatted for % with one decimal place.
R2-3.3 The portion of the data sheet labeled “Dep
System Sizing Corrections” starting at A26 uses all
Bottle A results to correct any offset in the mean
diameter found by deposition system and to evaluate
the pooled relative standard deviation for system
repeatability. Mean
A
is given by: =(B23+ E23)/2. s
DepA
is given by: =SQRT((B24^ 2+ E24^ 2)/2), and includes
day long contributions from system stability. The bias
correction Cert
A
−Mean
A
is given by: =C10-C27.
R2-3.4 Analysis
R2-3.4.1 The value for Dep Peak Uncertainty (row 34)
for Bottle A (or U
relA
) is given by:
=2*SQRT(C28^ 2+ H10^ 2). This combines the
uncertainty in the certified bottle with the uncertainty in
the deposition system at the diameter of Bottle A. The
factor of 2 is needed for expanded uncertainty.
R2-3.4.2 The expanded uncertainty equations for
Bottles B and C are slightly different and are the
combination of the relative uncertainty in the certified
value A (as a percent) and the relative uncertainty of the
deposition system at the broader distribution of
diameter B or C. The equation for the expanded
relative combined standard uncertainty of the
depositions of Bottle B is: =2*SQRT(C24^ 2+ H10^ 2),
and of those of Bottle C is: =2*SQRT(D24^ 2+ H10^ 2).
As noted in the standard (see 11.5 and 11.6), the first
term of this equation accounts for the variation due to
the uncertainty in the finding of the peak diameter of
Bottle B or C by the DMA and the second term
accounts for the uncertainty in the certified peak
diameter of the suspension in Bottle A, which is used to
correct the peak diameter of Bottle B or C as found by
the DMA.
R2-3.4.3 The FWHM (SSIS) values for Bottles A, B,
and C (row 35) are taken directly from D40, D52 and
J29, respectively.
R2-3.4.4 The uncorrected Peak (Dep System)
diameters for Bottles A, B, and C (row 36) are taken
directly from C27, C23, and D23 respectively.
R2-3.4.5 The corrections made in the next row (37)
employ the percentage error found by comparing the
certified peak diameter of Bottle A to the mean peak
diameter found by the deposition system. For Bottle A
this is: =C27+ C29. For Bottle B it is:
=C23*(1+ (C29/C10), and for Bottle C it is:
=D23*(1+ (C29/C10).
R2-3.4.6 The Peak (SSIS) values Bottles A, B, and C
(row 38) are taken directly from B40, B52, and H29,
respectively.
R2-3.4.7 The Measured Counts (row 39) are taken
directly from the SSIS data averages, E40, E52, or K29,
for Bottles A, B, and C, respectively.

SEMI M58-0704 © SEMI 2004 10
R2-3.5 Interpretation of Results
R2-3.5.1 A conditional command is used to
automatically grade results for Uncertainty and FWHM.
R2-3.5.1.1 The equation for Bottle B Uncertainty (row
50) is: =IF(J34>0.03," Fail" ," Pass" ), and the others are
similar.
R2-3.5.1.2 The equation for Bottle B FWHM (row 51)
is =IF(J35>0.05," Fail" ," Pass" ), and the others are
similar.
R2-3.5.2 These are the only two requirements of SEMI
M52 verified by this test method. Two additional
comparisons are made for information only:
R2-3.5.2.1 The SSIS Peak diameter is compared with
the corrected deposition system peak diameter (row 52).
For Bottle B the equation is =B52/J37, and the others
are similar.
R2-3.5.3 Finally, the SSIS mean count is compared
with the count from the deposition system (row 53).
The equation for Bottle B is =E52/$ D$ 13, and the
others are similar.
SEMI M58-0704 © SEMI 2004 11
Lab: Company ABC Identification of deposition system used:
1
Contact
N
. P. Teste
r
Supplier/Model # Dep Sys/45U
2
Address
456 Main Street System S/N 12345
3
Anywhere, CA, USA System S/W Revision 3
4
Phone
782-555-5555 Date of Test
5
email nptester@abcco.com
Date of Last Previous Test
N
ot applicable
6
7
Characteristics of Suspensions Used for Test
8
u
B
ottle i
%FWHM
i
9
B
ottle A, Certified
100.7 nm ± 0.5
nm (1
σ
) or
0.5% 2.0%
10
79 nm ± 2.6
nm (1
σ
) or
3.3% 10.0%
11
145 nm ± nominal
nm (1
σ
) or
not available unknown
12
Particles Deposited (
N
)
3000
13
S
upplier
P
art No.
L
ot No.
14
Deposition System Diameters (nm)
B
ottle A
N
IST SRM 1963 ? ?
15
B
ottle A
B
ottle B
B
ottle
C
B
ottle A
B
ottle B ? ? ? ? ? ?
16
D
ay
nm nm nm nm
B
ottle
C
? ? ? ? ? ?
17
1
101.5 79.6 155.6 101.0
18
2
100.5 79.0 153.9 101.0
19
3
101.0 78.2 154.6 102.0 SSIS Data: Bottle C
20
4
102.0 78.5 155.9 102.0
21
5
101.0 78.1 154.3 102.0
22
M
ean
101.2 78.7 154.9 101.6
D
ay
nm nm %
23
s
D
ep
0.6% 0.8% 0.6% 0.5%
1
149.2 3.3 2.21% 2815
24
2
148.9 3.6 2.42% 2548
25
Dep System Sizing Corrections
3
150.9 3.4 2.25% 2720
26
M
ean
A
=
101.4 nm
4
151.1 3.6 2.38% 2716
27
s
D
epA
=
0.6%
5
149.7 3.4 2.27% 2178
28
Cert
A
−
Mean
A
=
-0.7 nm
M
ean
150.0 3.5 2.31% 2595
29
Std Dev 0.994 0.134 0.088%
252.4
30
SSIS Data: Bottle A
31
Analysis
32
B
ottle A
B
ottle B
B
ottle
C
33
D
ay
nm nm %
D
ep Peak Uncertainty
1.5% 1.9% 1.5%
34
1
95.6 2.1 2.20% 2178
F
WHM (SSIS)
2.3% 3.3% 2.3%
35
2
95.9 2.2 2.29% 2418
P
eak (Dep System)
101.4 78.7 154.9
36
3
96.1 2.3 2.39% 2555
P
eak (Dep Sys Corrected)
100.7 78.1 153.8
37
4
96.1 2.2 2.29% 2512
P
eak (SSIS)
96 72 150
38
5
96.2 2.2 2.29% 1929
M
easured Count
2318 2524 2595
39
M
ean
96.0 2.2 2.29% 2318
40
Std Dev 0.239 0.071 0.070% 262.1
Compare Quantity with Limit
41
42
SSIS Data: Bottle B
Uncertainty Limit
43
F
WHM Limi
t
44
SSIS Peak
45
D
ay
nm nm %
SSIS Count
46
1
72.6 2.4 3.31% 2297
47
2
71.6 2.3 3.21% 2690 Interpretation of Results
48
3
72.2 2.3 3.19% 2742
B
ottle A
B
ottle B
B
ottle
C
49
4
72.2 2.3 3.19% 2735
Uncertainty
Pass Pass Pass
50
5
71.2 2.5 3.51% 2156 Pass Pass Pass
51
M
ean
72.0 2.4 3.28% 2524
SSIS/Dep Peak Comp
0.95 0.92 0.98
52
Std Dev 0.555 0.089 0.138%
276.8
SSIS/Dep Count Comp
0.77 0.84 0.87
53
A B C D E F G H I J K
August 20, 2003
B
ottle B
B
ottle
C
S
uspension
P
ea
k
Diameter
M
easured
Peak
F
WHM
on Wafer
R
elative
F
WHM
Count
F
WHM
Dep Sys Corrected Peak (Info only)
5.0% (SEMI M52)
3.0% (SEMI M52)
Dep System Count (Info only)
Count
L
imi
t
F
WHM
on Wafer
M
easured
Peak
R
elative
F
WHM
Quantity
Count
R
elative
F
WHM
M
easured Pea
k
F
WHM on
Wafer
Figure R2-1
Example Test Results