semi合集-English.pdf - 第4124页
SEMI F62-0701 © SEMI 2001 4 15.1.3 The g as temperature coeff icien t o f flow is to be calculated as follows: 100 x ) 1 T - 2 T ( x Q 1 Q - 2 Q = C) (%/ TC g g sp a a g ° where Q a1 and Q a2 are the actual flow rates me…

SEMI F62-0701 © SEMI 20013
12 Calibration and Standardization
12.1 The flow standard, temperature standards, and
pressure standards used are to be NIST traceable.
12.2 All ancillary equipment must be calibrated and
maintained to the manufacturer's recommendations.
Current calibration records must be maintained.
13 Conditioning
13.1 Reference conditions as listed in Appendix 1 are
to be maintained unless otherwise noted.
14 Procedure
14.1 Environmental Temperature Effect
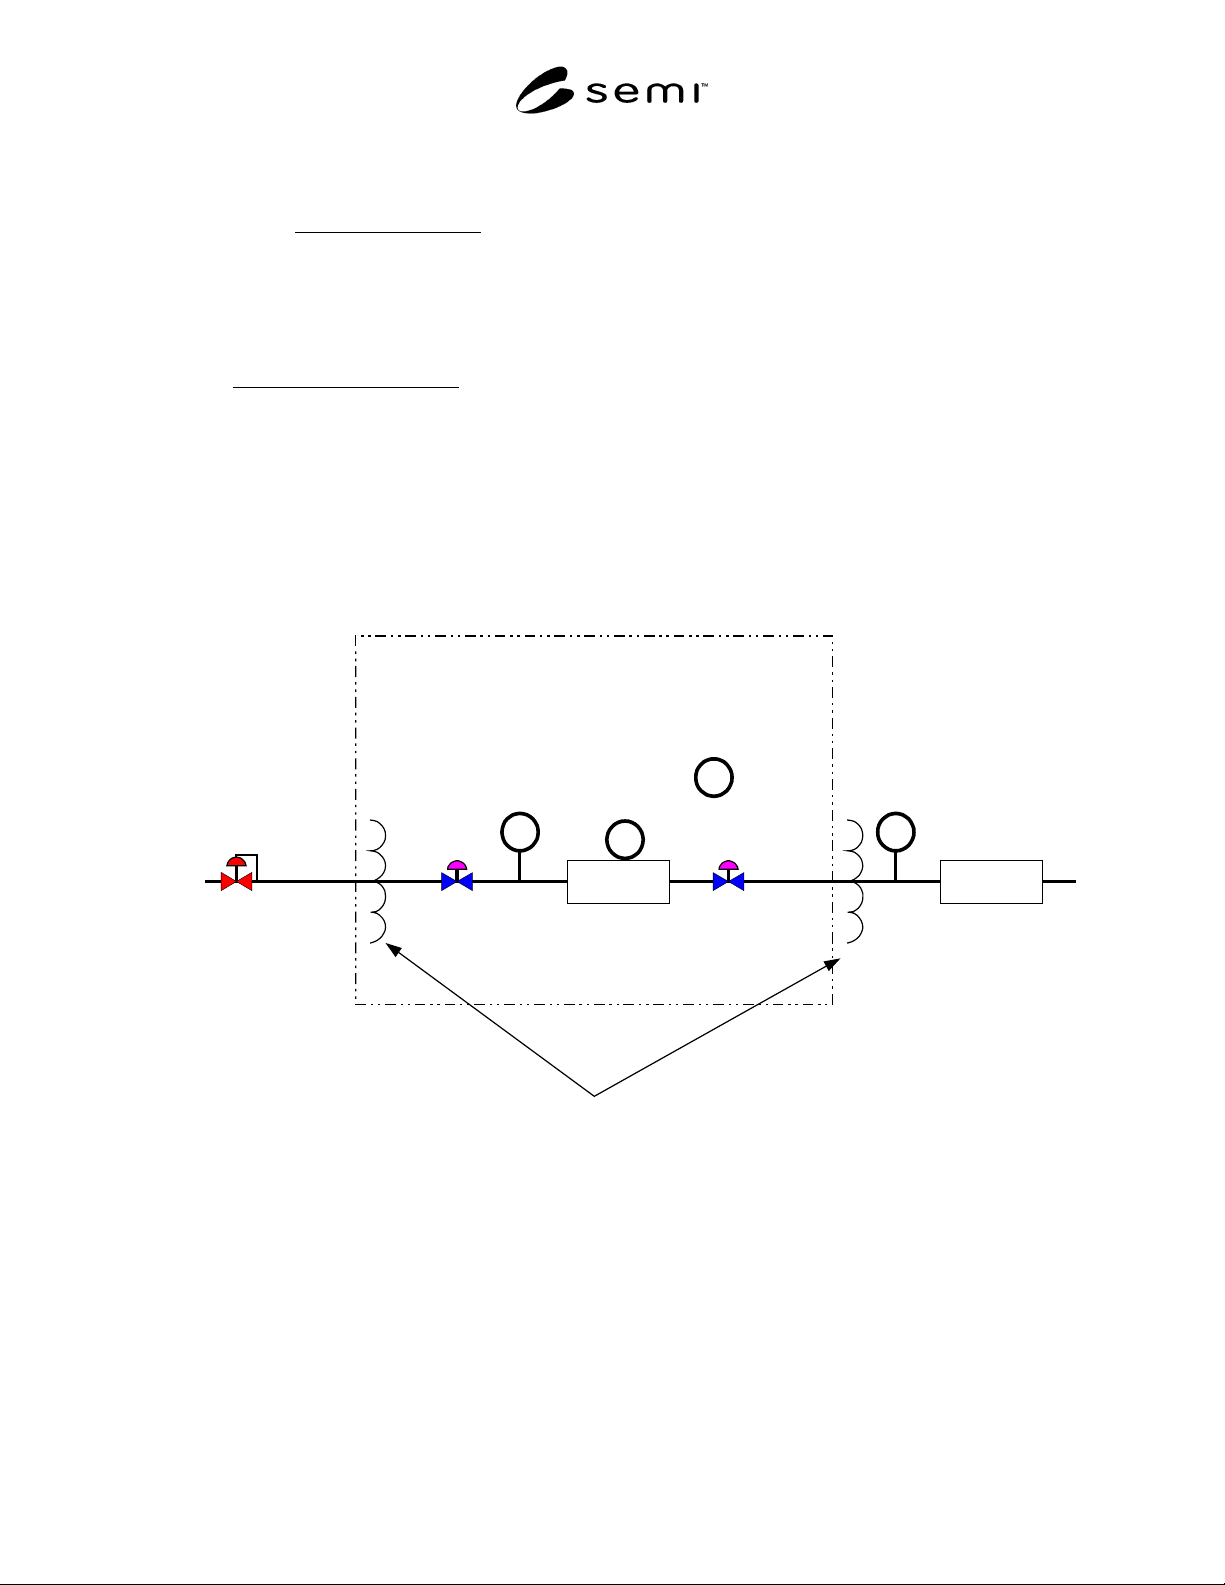
14.1.1 Install the test specimen in the test set-up
according to the manufacturer's recommendations, see
Figure 1a.
14.1.2 Set the environmental chamber temperature
(T
e
) to T
min
and allow it to stabilize for one hour.
Ensure that gas temperature (T
g
) and ambient
temperature (T
e
) are within 2°C of each other before
beginning data collection.
14.1.3 Close V
ii
and V
io
, and record the MFC Q
ind
at a
zero setpoint.
14.1.4 Open V
ii
and V
io
. Change the MFC flow
setpoints to 25%, 50%, 75%, and 100% of full rated
scale.
NOTE 1: T
g
and T
e
must be within 2°C of each other.
14.1.5 At each setpoint, record T
g
, Q
in d
once, and a
minimum of 10 values at a maximum of five second
intervals of T
e
and Q
a
for at least 60 seconds. Record
the average of the 10 values as shown in Table 3.
14.1.6 Repeat Section 14.1.3.
14.1.7 Maintain the setpoint at zero and change the
environmental chamber temperature T
em
to the next
level indicated in Figure 2.
14.1.8 Record the Q
ind
at the zero setpoint in real time
(max 30-second intervals) as the temperature T
e
is
changing. See example of data collection shown in
Table 4.
14.1.9 Allow temperature T
e
to stabilize for a
minimum of one hour.
NOTE 2: The time for the T
e
to stabilize at each level should
be increased to two hours if the indicated flow at T
e
level 1
and 9, or 2 and 8, or 3 and 7, or 4 and 6 are not within 5% of
each other. See Figure 2.
14.1.10 Open the isolation valves V
ii
and V
io
.
14.1.11 Repeat Sections 14.1.3–14.1.9 for each T
e
level, as shown in Figure 2.
14.2 Gas Temperature Effect
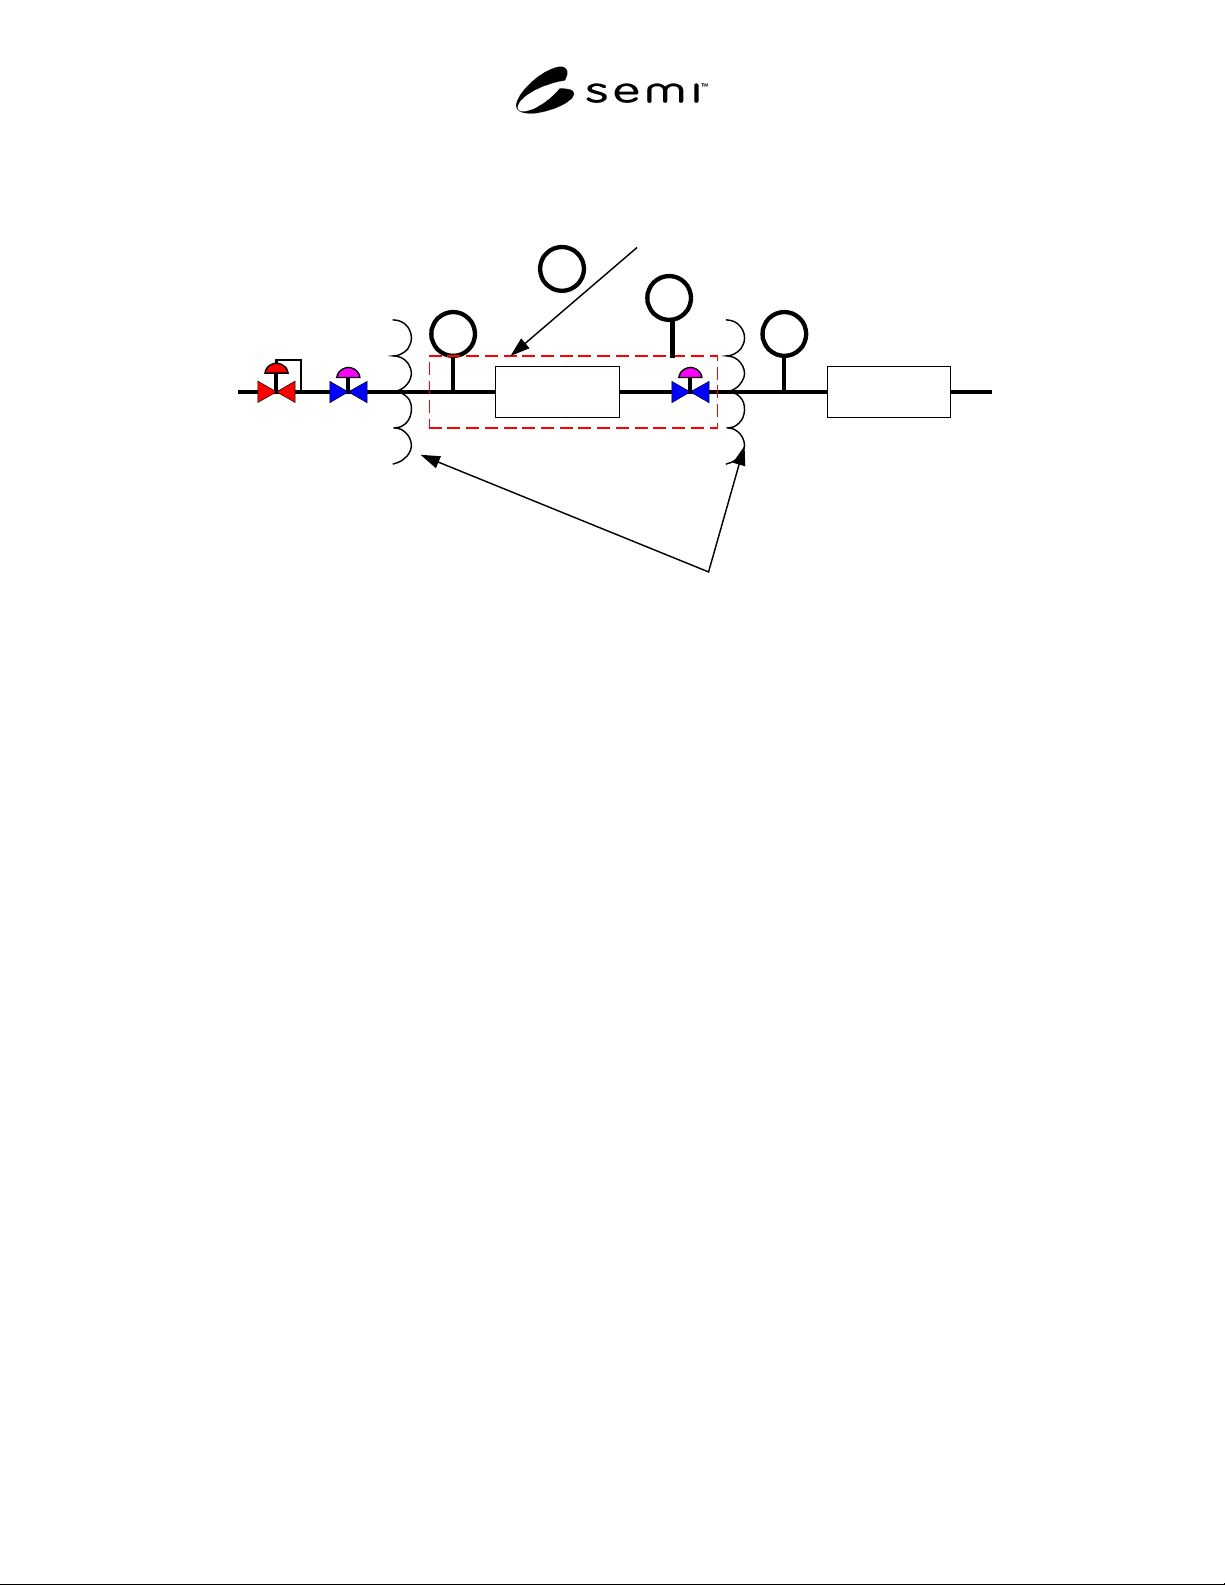
14.2.1 Install the test specimen in the test set-up
according to the manufacturer's recommendations, see
Figure 1b.
14.2.2 Allow the system to stabilize for one hour. See
Figure 1. Refer to Figure 4 for flow chart.
14.2.3 Set the heater temperature to raise the gas
temperature, T
g
, such that T
g
is elevated 10°C above
ambient.
14.2.4 Simultaneously open V
ii
and close V
io
.
Continue to monitor T
g
, T
e
, indicated flow, and actual
flow for one hour. If after one hour, the actual flow or
T
g
has not achieved long-term stability, or if T
g
is not
equal to T
e
+ 10 (±2°C), continue until these conditions
are met or until an additional one hour period has
elapsed. If long-term stability is not achieved, note this
occurrence and record the average value of 10 samples
minimum taken at maximum five-second intervals for
each of T
g
, T
e
, indicated flow, and actual flow as shown
in Table 5, for at least 60 seconds.
NOTE 3: If T
g
is not 10°C above ambient return to 14.2.3
and adjust the temperature.
14.2.5 Repeat 14.2.3–14.2.4 until all required setpoints
have been run.
15 Calculations or Interpretation of Results
15.1 Calculations
15.1.1 The measured values for Q
ind
, Q
a
, and T
g
are
determined by an arithmetic average of samples taken
at time intervals after stability has been achieved at
each temperature and flow condition.
15.1.2 The ambient temperature coefficient of flow
shall be calculated as follows:
100 x
)1
T
- 2
T
( x
Q
1
Q
- 2
Q
= C)(%/
TC
ee
sp
aa
e
°
where Q
a1
and Q
a2
are the actual flow rates measured at
ambient temperatures T
e1
and T
e2
respectively. For zero
setpoint use the following.
100 x
)1
T
- 2
T
( x
Q
1
Q
- 2
Q
=
TC
gg
fullscale
aa
zero
This yields a result expressed as a percent of reading
per °C. See example of data collection and analysis
shown in Table 3. Final TC
e
is to be presented in Table
2 format.
SEMI F62-0701 © SEMI 2001 4
15.1.3 The gas temperature coefficient of flow is to be
calculated as follows:
100 x
)1
T
- 2
T
( x
Q
1
Q
- 2
Q
= C)(%/
TC
gg
sp
aa
g
°
where Q
a1
and Q
a2
are the actual flow rates measured at
gas temperatures T
g1
and T
g2
respectively. For zero
setpoint use the following.
100 x
)1
T
- 2
T
( x
Q
1
Q
- 2
Q
=
TC
gg
fullscale
aa
zero
This yields a result expressed as a percent of reading
per °C. Refer to Table 5 for an example of data
collection and analysis. Final TCg is to be presented in
Table 1 format.
16 Reporting Results
NOTE 4: All special features (remote electronics, auto zero,
etc.) should be noted on the testing results for comparative
analysis.
16.1 The gas temperature coefficient at each flow rate
is to be displayed as shown in Table 1.
16.2 The gas temperature coefficient data from Table
1 is to be displayed as shown in Figure 5. The gas
temperature, actual flow, and indicated flow are to be
displayed versus time as shown in Figure 6.
16.3 The ambient temperature coefficient is to be
presented in tabular form as shown in Table 2.
16.4 The data for the steady-state effect from Table 2
should be presented as shown in Figure 7. The data for
the transient effect from Table 4 should be presented as
shown in Figure 8.
17 Illustrations
Figure 1a
Ambient Temperature Effect Test Apparatus
DUT
Flow
Standard
Temperature Controlled
Environment
Tg
TE
Ts
N2 in
Heat Exchangers
Vii Vio
TA
SEMI F62-0701 © SEMI 20015
Figure 1b
Gas Temperature Effect Test Apparatus
NOTE 5: Flow Standard may be located upstream or down stream.
Step m T
em
1. T
min
2. T
min
+ 1/4 (T
max
- T
min
)
3. T
min
+ 1/2 (T
max
- T
min
)
4. T
min
+ 3/4 (T
max
- T
min
)
5. T
max
6. T
min
+ 3/4 (T
max
- T
min
)
7. T
min
+ 1/2 (T
max
- T
min
)
8. T
min
+ 1/4 (T
max
- T
min
)
9. T
min
Figure 2
Ambient Temperature Setpoint (T
em
)
DUT
Tg
Flow
Standard
Ts
Hot Plate or Heater Tape
Surrounding MFC Base
not MFC electronics
N2
Heat Exchangers
TB
TE
Vii Vio