semi合集-English.pdf - 第5413页
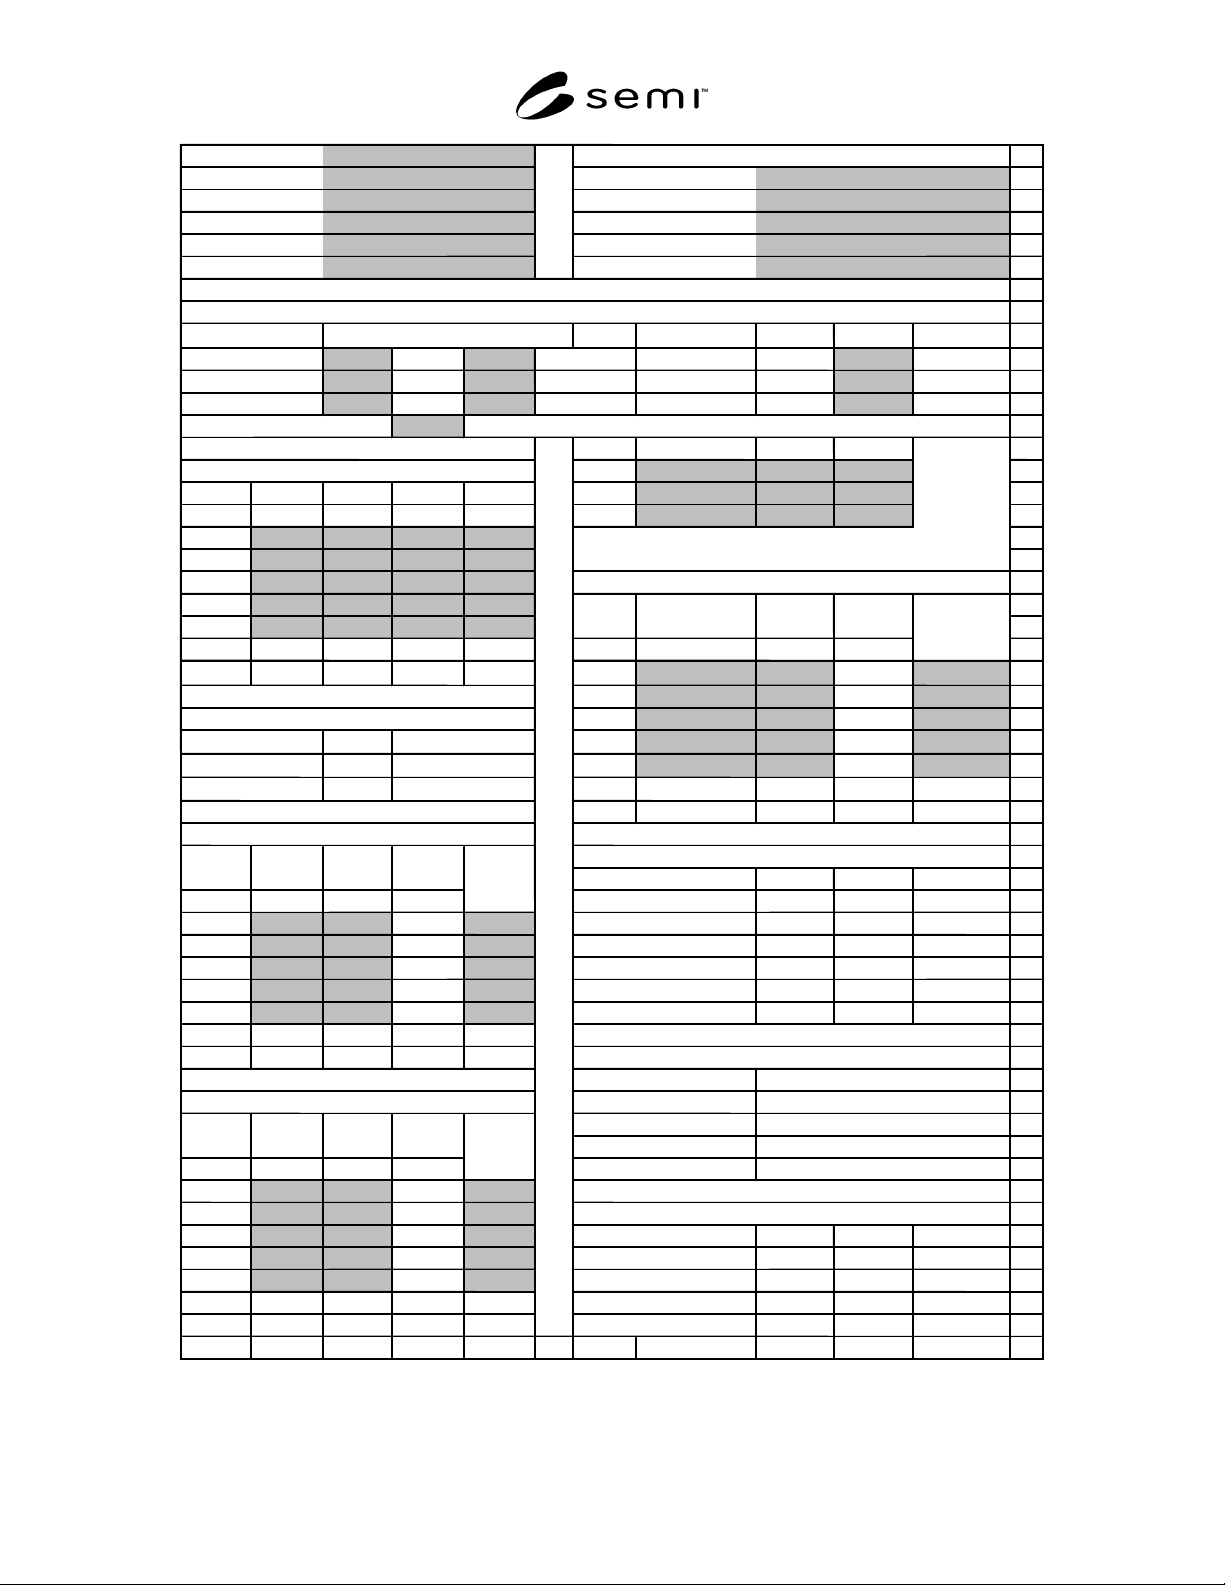
SEMI M58-0704 © SEMI 2004 6 Lab: Identification of deposition system used: 1 Contact Supplier/Model # 2 Address System S/N 3 System S/W Revision 4 Phone Date of Test 5 email Date of Last Previous Test 6 7 Characteristics…

SEMI M58-0704 © SEMI 2004 5
where:
s
DepC
= relative standard deviation of the measured
p
eak from Bottle C taken from the
Deposition System Diameter Data: Bottle C
portion of the data sheet, and
u
BottleA
has the same meaning as in Equation (1). Again,
the first term of this equation accounts for the variation
due to the uncertainty in the finding of the peak
diameter of Bottle C by the DMA and the second term
accounts for the uncertainty in the certified peak
diameter of the suspension in Bottle A, which is used to
correct the peak diameter of Bottle C as found by the
DMA. Record the result as a percentage to one decimal
place in the Bottle C column of the Dep Peak
Uncertainty row of the Analysis portion of the data
sheet. Take the peak height of the deposition as the
chosen value of deposition diameter corrected as
follows:
−
+=
A
AA
CC
Cert
MeanCert
MeanPeakDia 1
(5)
where:
Mean
C
= value of the mean chosen deposition
diameter from Bottle C taken from the
Deposition System Diameter Data portion o
f
the data sheet, and
Mean
A
and Cert
A
have the same meaning as in Equation
(3). Record PeakDia
C
in the Bottle C column of the
Peak(DepSysCorrected) row of the Analysis portion of
the data sheet.
11.7 Record the Mean Relative FWHM values for each
of the three bottles in the SSIS Data sections as
percentages with one decimal place in the FWHM SSIS
row of the Analysis portion of the data sheet.
11.8 Average the two mean deposition system
diameters for Bottle A found in the Deposition System
Diameter data and record this average and the mean
deposition system diameters for Bottles B and C in the
Peak (Dep System) row of the Analysis portion of the
data sheet. This is additional information only.
11.9 Record the Mean Measured Peak from the three
SSIS Data sections for each of the three Bottles in the
Peak (SSIS) row of the Analysis portion of the data
sheet. This is additional information only.
11.10 Record the value of N (Particles Deposited) in the
Count row of the Analysis portion of the data sheet.
12 Interpretation of Results
12.1 If a value for Bottle A, B, or C in the Dep Peak
Uncertainty row of the Analysis portion of the data
sheet is greater than 3.0%, the deposition system cannot
be used with this bottle or these settings to produce
calibration standards that meet the uncertainty
requirements of SEMI M52.
12.2 If a value for Bottle A, B, or C in the FWHM row
of the Analysis portion of the data sheet is greater than
5.0%, the deposition system cannot be used with this
bottle or these settings to produce calibration standards
that meet the FWHM requirements of SEMI M52.
12.3 Although it is not required by SEMI M52, the
mean for the deposited diameters determined by the
SSIS can be compared to the values found by the
deposition system and the PSL sphere manufacturer. A
significant difference in mean may imply that the SSIS
is not properly calibrated.
12.4 Although it is not required by SEMI M52, the
mean count values determined by the SSIS may be
compared to the count value set by the deposition
system. A significant difference may imply that the
deposition system needs to be adjusted.
13 Report
13.1 Report all the information, data, and calculations
recorded on the data sheet. A completed example of
such a report is provided in Related Information 2.
14 Precision and Bias
14.1 No data regarding precision and bias are presently
available. At present there are no plans to develop such
data, but should such data become available, it will be
added to this test method.
SEMI M58-0704 © SEMI 2004 6
Lab: Identification of deposition system used:
1
Contact Supplier/Model #
2
Address
System S/N
3
System S/W Revision
4
Phone
Date of Test
5
email Date of Last Previous Test
6
7
Characteristics of Suspensions Used for Test
8
u
B
ottle i
%FWHM
i
9
B
ottle A, Certified
nm ±
nm (1
σ
) or
10
nm ±
nm (1
σ
) or
11
nm ±
nm (1
σ
) or
12
Particles Deposited (
N
)
13
S
upplier
P
art No.
L
ot No.
14
Deposition System Diameters (nm)
B
ottle A
15
B
ottle A
B
ottle B
B
ottle
C
B
ottle A
B
ottle B
16
D
ay
nm nm nm nm
B
ottle
C
17
1
18
2
19
3
SSIS Data: Bottle C
20
4
21
5
22
M
ean
D
ay
nm nm %
23
s
D
ep
1
24
2
25
Dep System Sizing Corrections
3
26
M
ean
A
=
nm
4
27
s
D
epA
= 5
28
Cert
A
−
Mean
A
=
nm
M
ean
29
Std Dev
30
SSIS Data: Bottle A
31
Analysis
32
B
ottle A
B
ottle B
B
ottle
C
33
D
ay
nm nm %
D
ep Peak Uncertainty
34
1
F
WHM (SSIS)
35
2
P
eak (Dep System)
36
3
P
eak (Dep Sys Corrected)
37
4
P
eak (SSIS)
38
5
M
easured Count
39
M
ean
40
Std Dev
Compare Quantity with Limit
41
42
SSIS Data: Bottle B
Uncertainty Limit
43
F
WHM Limi
t
44
SSIS Peak
45
D
ay
nm nm %
SSIS Count
46
1
47
2
Interpretation of Results
48
3
B
ottle A
B
ottle B
B
ottle
C
49
4 Uncertainty
50
5
51
M
ean SSIS/Dep Peak Comp
52
Std Dev SSIS/Dep Count Comp
53
A B C D E F G H I J K
M
easured Pea
k
S
uspension
P
eak Diamete
r
B
ottle B
B
ottle
C
R
elative
F
WHM
Count
F
WHM
F
WHM on
Wafer
Quantity
L
imi
t
Count
R
elative
F
WHM
M
easured
Peak
F
WHM
on Wafer
3.0% (SEMI M52)
Count
5.0% (SEMI M52)
Dep Sys Corrected Peak (Info only)
Dep System Count (Info only)
M
easured
Peak
F
WHM
on Wafer
R
elative
F
WHM
Figure 1
Example of Data, Calculation, and Analysis Sheet for Test Procedure
SEMI M58-0704 © SEMI 2004 7
RELATED INFORMATION 1
BACKGROUND INFORMATION ON THE OPERATION OF A
DIFFERENTIAL MOBILITY ANALYZER
NOTICE: This related information is not an official part of SEMI M58 and was derived from information
developed during drafting of the standard. This related information was approved for publication by full letter ballot
procedures on April 22, 2004.
R1-1 Deposition systems include a nebulizer for
producing a PSL sphere aerosol by spraying and
evaporating a suspension of PSL spheres in high purity
water, a differential mobility analyzer (DMA) for
selecting a monodisperse fraction of the aerosol, and
then a chamber to electrostatically deposit the spheres
onto wafers. Here we focus on the DMA, which is used
for both isolating a monodisperse size fraction and for
sizing the particles. A brief description of the
instrumentation and methodology is given below; a
detailed description is given by Kinney et al.
3
R1-2 The particles leaving the nebulizer pass through a
bipolar charger that produces a charge distribution that
depends only on the size of the particles and not on
their initial charge. For 100 nm particles, about 45% of
the particles are uncharged, about 20% have + 1 electron
charge, another 20% have –1 electron charge, and much
smaller fractions have multiple charges. As illustrated
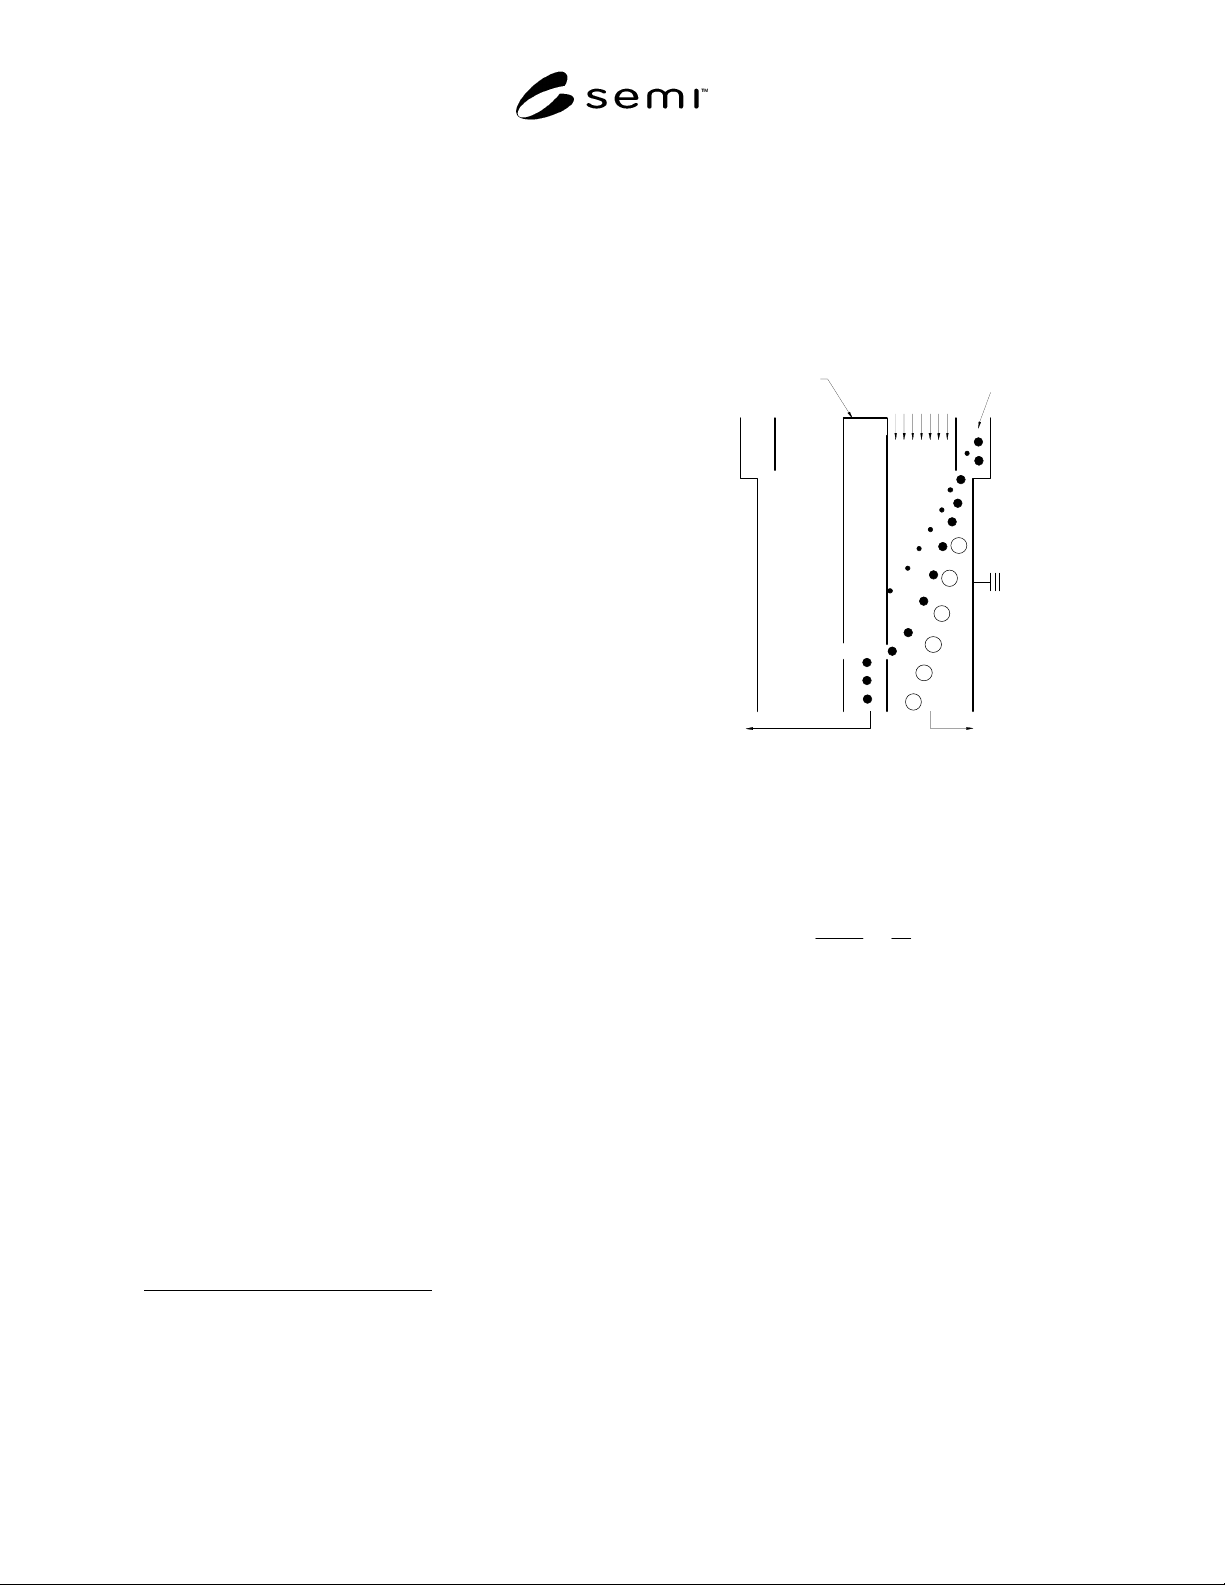
in Figure R1-1, the DMA consists of an inner
cylindrical rod connected to a variable high voltage dc
power supply and an outer annular tube connected to
ground. Clean sheath air flows through the axial
region, while the charged aerosol enters through an
axisymmetric opening along the outer cylinder. The
positively charged PSL spheres move radially towards
the center rod under the influence of the electric field.
Near the bottom of the classifying region, a fraction of
the air flow consisting of near-monodisperse aerosol
exits through a slit in the center rod. The quantity
measured by the DMA is the electrical mobility, Z
p,
defined as the velocity a particle attains under a unit
electric field. Knutson and Whitby
4
derived an expres-
sion for the average value of Z
p
for particles entering
the slit involving the peak electrode voltage, V, the
sheath air flow rate, Q
c
, the inner and outer radii of the
cylinders, r
1
and r
2
, and the length of the central
electrode down to the slit, L:
3 Kinney, P.D., Pui, D. Y. H., Mulholland, G. W., and Bryner, N.,
“Use of the Electrostatic Classification Method to Size 0.1 µm
SRM Particles − A Feasibility Study,” J. Res. Natl. Inst. Technol.,
96, 147−176 (1991).
4 Knutson, E. O., and Whitby, K. T. “Aerosol Classification by
Electric Mobility: Apparatus, Theory, and Applications,” J. Aer. Sci.
6: 443–451 (1975).
Monodisperse
Aerosol
Excess Ai
r
Charged
Aerosol
Clean
Air
High Voltage
Figure R1-1
Monodisperse Aerosol Selected in a Differential
Mobility Analyzer from a Polydisperse Aerosol
Based on the Size Dependence of the Electrical
Mobility
π
=
1
2
ln
2 r
r
VL
Q
Z
c
p
(R1-1)
R1-3 This equation is valid provided the sheath air
flow, Q
c
, is equal to the excess flow, Q
m
, leaving the
classifier. They derived an expression for the transfer
function, defined as the probability that a particle will
leave the sampling slit. The transfer function is of great
importance, because the size distribution of the aerosol
exiting the DMA is proportional to the convolution of
the transfer function with the particle size distribution
function. The transfer function has a triangular shape
with a peak value of 1. The ratio of the base of the
transfer function triangle in terms of voltage divided by
the peak voltage is predicted to be 2(Q
s
/Qc), where Q
s
is the flow of monodisperse aerosol.
R1-4 This ratio is also equal to the ratio of the full
width of the mobility distribution to the peak value.
For a flow ratio of 1 to 20, one finds that the full width
at half maximum of the peak mobility (FWHM) is
equal to 5% of the peak mobility. For 100 nm particle