semi合集-English.pdf - 第4198页
SEMI F72-1102 © SEMI 2002 9 the presence of the carbon layer and the depth of analysis. Theoret ical 0 10 20 30 40 50 60 70 80 90 100 0 5 10 15 20 25 30 35 40 45 Angstroms Atomic Concentration Cr Fe Ni Mo O C Figure A1-1…
SEMI F72-1102 © SEMI 2002 8
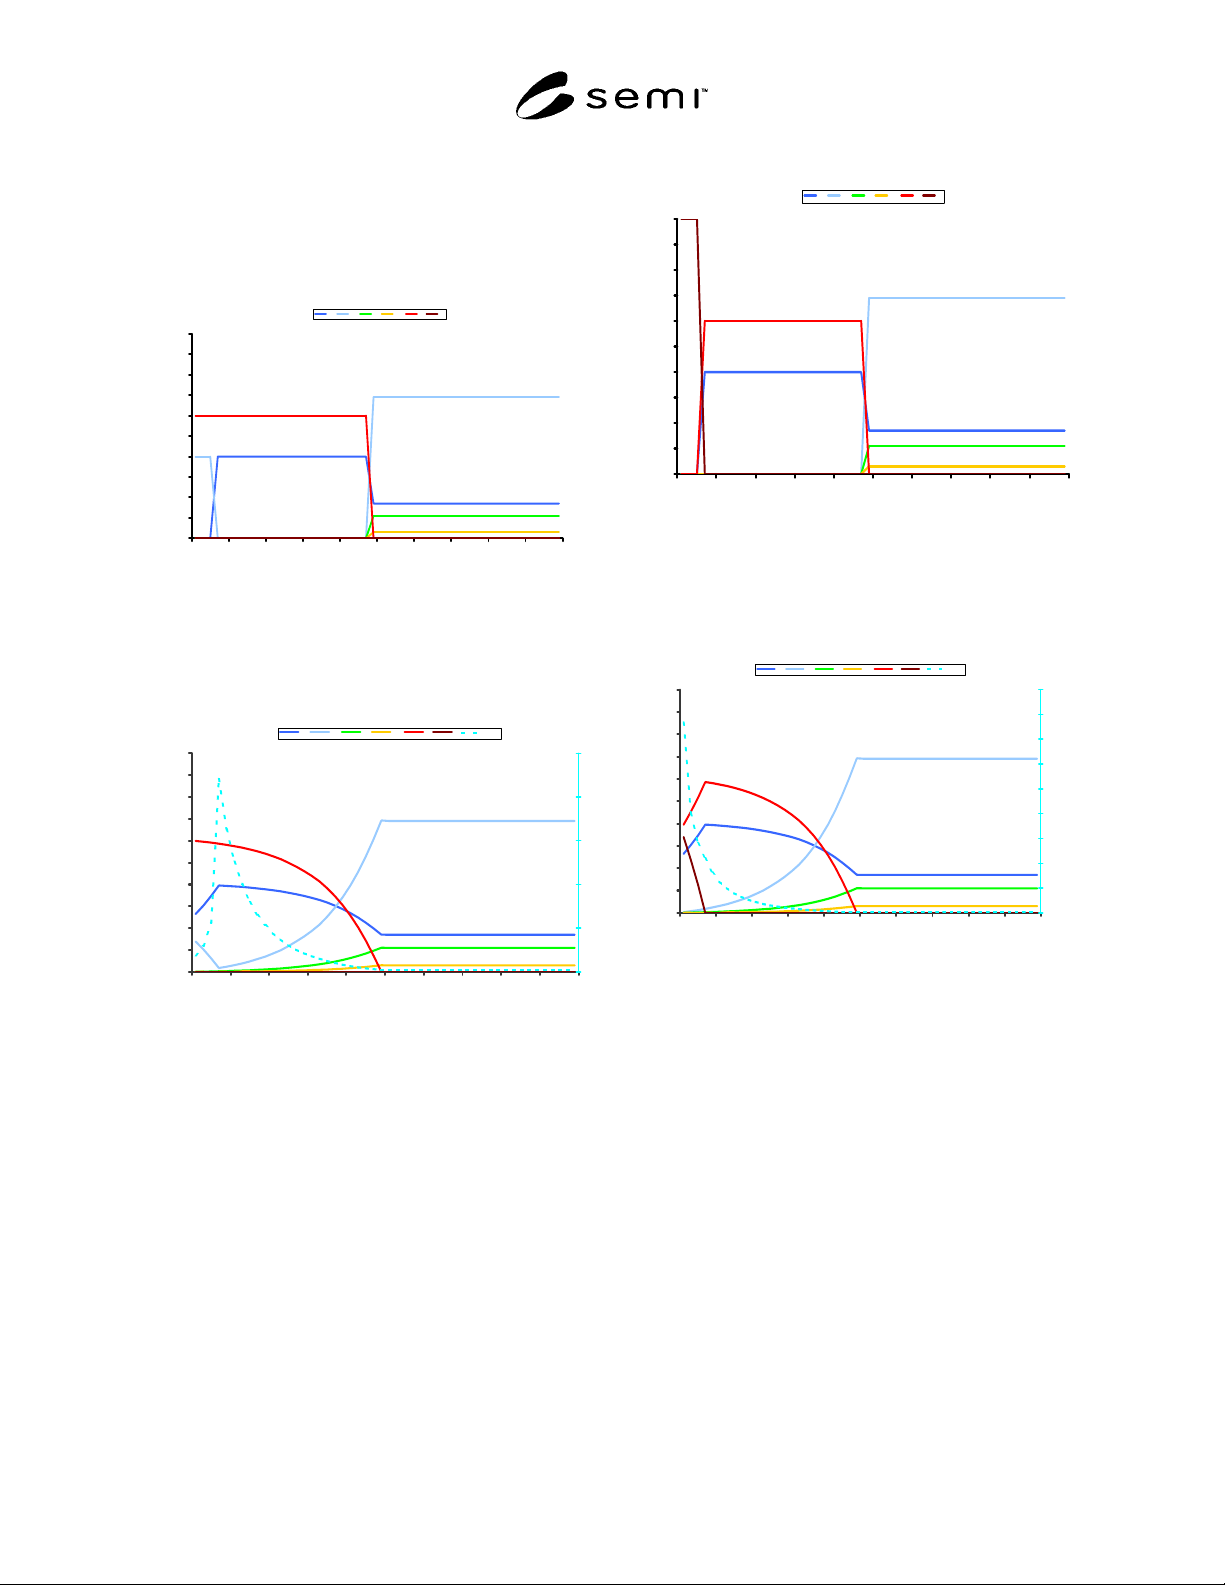
that the Oxygen concentration profile initially increases
to a maximum, then decreases. This is typical of
Oxygen concentration profiles seen on actual samples,
which will generally have some adsorbed hydrocarbon
contamination on the surface.
Theoretical
0
10
20
30
40
50
60
70
80
90
100
0 5 10 15 20 25 30 35 40 45
Angstroms
Atomic Concentration
Cr Fe Ni Mo O C
Figure A1-6
Composition Versus Depth of a Fe
2
O
3
Layer Over a
Cr
2
O
3
Layer on Stainless Steel
Convoluted 5 Lambda
0
10
20
30
40
50
60
70
80
90
100
0 5 10 15 20 25 30 35 40 45
Angstroms
Atomic Concentration
0
5
10
15
20
25
Cr Fe Ni Mo O C Cr:Fe
Figure A1-7
Theoretical Depth Profile of Figure A1-6 Assuming
5λ Depth of Analysis
Theoretical
0
10
20
30
40
50
60
70
80
90
100
0 5 10 15 20 25 30 35 40 45
Angstroms
Atomic Concentration
Cr Fe Ni Mo O C
Figure A1-8
Composition Versus Depth of a Carbon Layer Over
a Cr
2
O
3
Layer on Stainless Steel
Convoluted 5 Lambda
0
10
20
30
40
50
60
70
80
90
100
0 5 10 15 20 25 30 35 40 45
Angstroms
Atomic Concentration
0
10
20
30
40
50
60
70
80
90
Cr Fe Ni Mo O C Cr :Fe
Figure A1-9
Theoretical Depth Profile of Figure A1-8 Assuming
5λ Depth of Analysis
A1-7 Effects of Hydrocarbon Contamination
over Detached Iron Oxide Layer
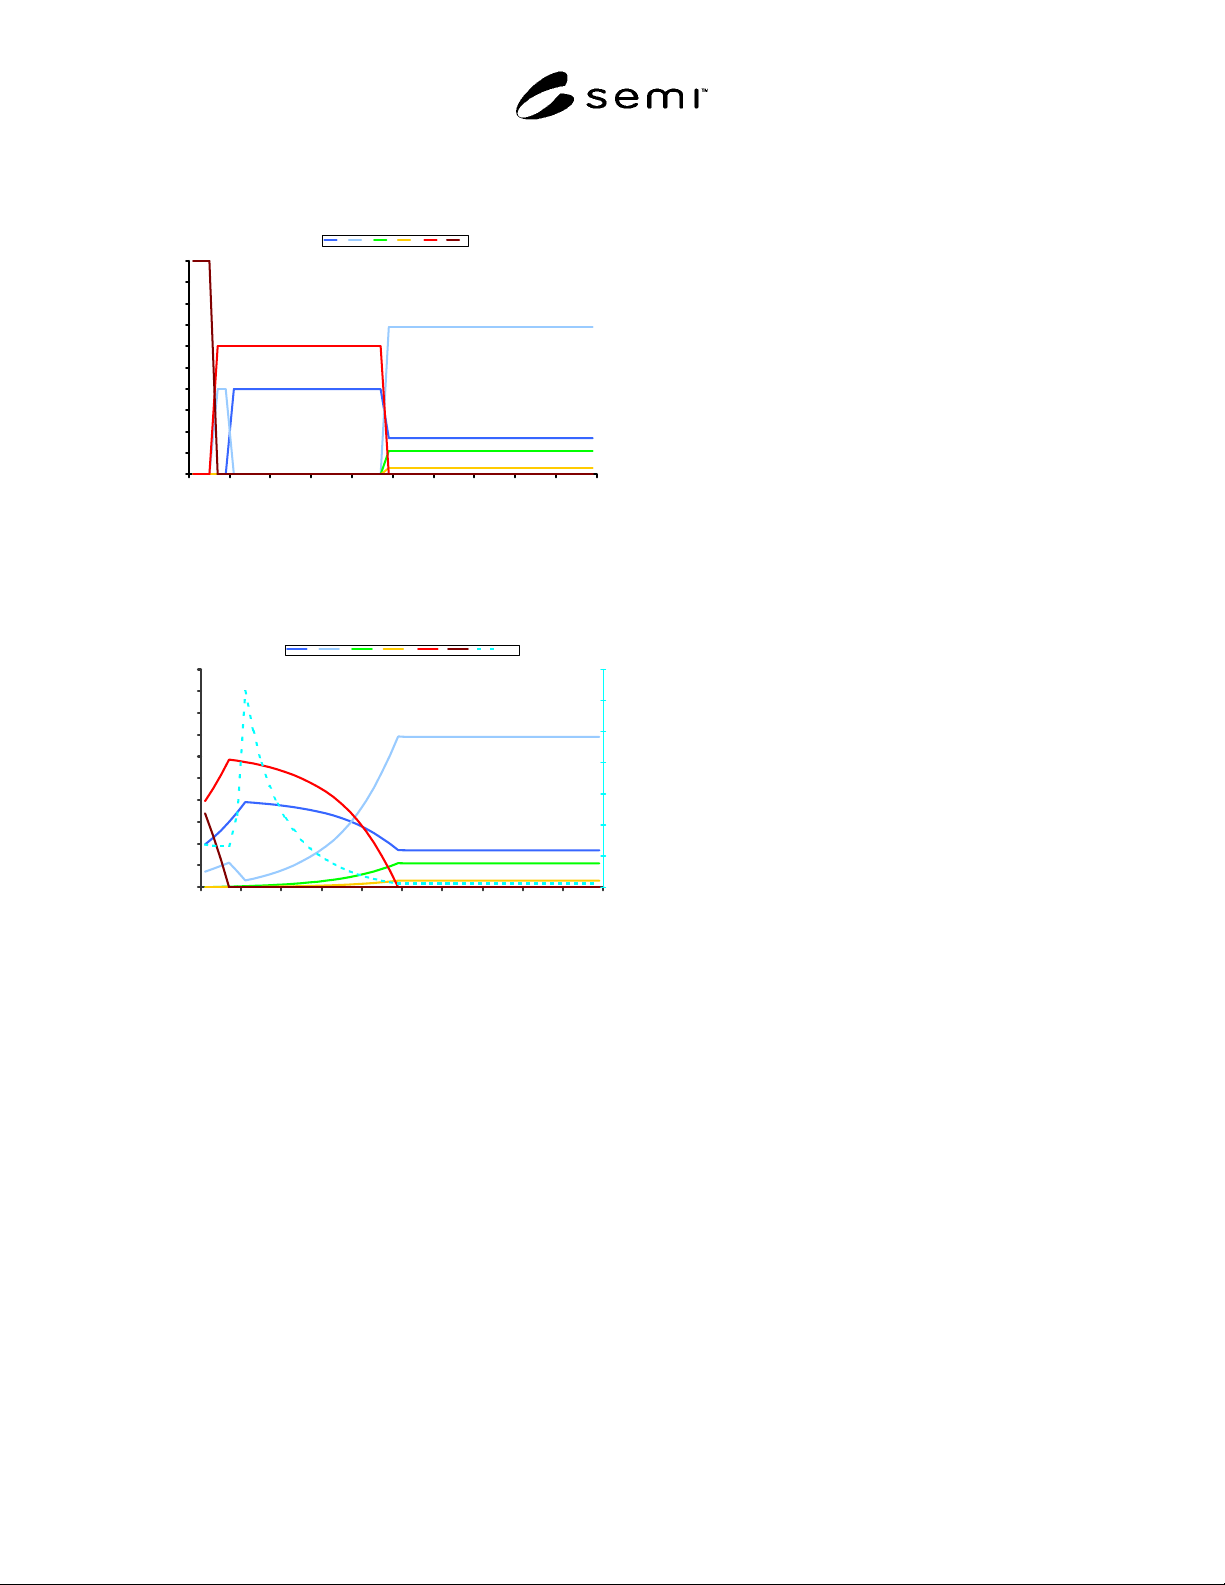
A1-7.1 The model composition profile of Figure A1-
10 shows a 3 angstrom carbon layer over 3 angstroms
of pure Fe
2
O
3
over 19 angstroms of pure Cr
2
O
3
on 316L
stainless steel. Figure A1-11 is the theoretical depth
profile of this model assuming a depth of analysis of 5
λ. This profile is seen to be similar to the depth profiles
generally observed for passivated stainless steel. The
Cr:Fe ratio maximum occurs below the initial surface,
and the initial surface atomic concentrations of the
elements of interest are diluted by the presence of the
carbon layer on the surface. The oxide thickness, as
measured by the FWHM technique, is affected by both
SEMI F72-1102 © SEMI 2002 9
the presence of the carbon layer and the depth of
analysis.
Theoretical
0
10
20
30
40
50
60
70
80
90
100
0 5 10 15 20 25 30 35 40 45
Angstroms
Atomic Concentration
Cr Fe Ni Mo O C
Figure A1-10
Composition Versus Depth of a Carbon Layer Over
a Fe
2
O
3
Layer Over a Cr
2
O
3
Layer on Stainless Steel
Convoluted 5 Lambda
0
10
20
30
40
50
60
70
80
90
100
0 5 10 15 20 25 30 35 40 45
Angstroms
Atomic Concentration
0
2
4
6
8
10
12
14
Cr Fe Ni Mo O C Cr:Fe
Figure A1-11
Theoretical Depth Profile of Figure 11 Assuming 5λ
Depth of Analysis
A1-8
A1-8.1 It must be emphasized that these derived depth
profiles are for models with perfect interfaces and
perfect compositions instead of the compositional
gradients observed in real systems. Additional
measurement uncertainties result from roughness and
non-planarity of the surface, and from differential
sputtering rates for different chemical species during
depth profiling.
A1-8.2 The depth profiles of real systems must be
interpreted with an understanding of the effects
described in this appendix and a realization that they
are not ideal. The same considerations pertain to ESCA
depth profile analysis.
NOTICE: SEMI makes no warranties or
representations as to the suitability of the standards set
forth herein for any particular application. The
determination of the suitability of the standard is solely
the responsibility of the user. Users are cautioned to
refer to manufacturer's instructions, product labels,
product data sheets, and other relevant literature,
respecting any materials or equipment mentioned
herein. These standards are subject to change without
notice.
By publication of this standard, Semiconductor
Equipment and Materials International (SEMI) takes no
position respecting the validity of any patent rights or
copyrights asserted in connection with any items
mentioned in this standard. Users of this standard are
expressly advised that determination of any such patent
rights or copyrights, and the risk of infringement of
such rights are entirely their own responsibility.
Copyright by SEMI® (Semiconductor Equipment and Materials
International), 3081 Zanker Road, San Jose, CA 95134. Reproduction o
f
the contents in whole or in part is forbidden without express written
consent of SEMI.

SEMI F73-1102 © SEMI 2002 1
SEMI F73-1102
TEST METHOD FOR SCANNING ELECTRON MICROSCOPY (SEM)
EVALUATION OF WETTED SURFACE CONDITION OF STAINLESS
STEEL COMPONENTS
This test method was technically approved by the Global Gases Committee and is the direct responsibility of
the North American Gases Committee. Current edition approved by the North American Regional Standards
Committee on August 29, 2002. Initially available at www.semi.org September 2002; to be published
November 2002.
1 Purpose
1.1 This document defines a uniform procedure for
testing the wetted surfaces of stainless steel components
intended for installation into high purity gas distribution
systems. This procedure characterizes the occurrence,
frequency, and in some cases the identity of
microscopic surface defects and contaminants that may
appear on the wetted surfaces. It should be noted that
there has been no direct correlation made between the
results of this test method and contamination of process
gases or product yields in processes served by high
purity gas distribution systems. Application of this test
method is intended to yield comparable and
reproducible results among various users of this method
for the purposes of qualification of components.
1.2 The objective of this method is to describe a
general set of instrument parameters and conditions that
will achieve precise and reproducible measurements of
important parameters regarding the surface condition.
2 Scope
2.1 This procedure applies to the wetted surfaces in
stainless steel tubing, fittings, valves, and other
components to determine the effectiveness of surface
finishing and cleaning processes. The technique
describes counting of surface defects including pits,
inclusions, inclusion stringers, scratches, residual
process marks, grain boundaries and contamination on
the wetted surfaces. However, any surface damage
produced during sample preparation is to be excluded
from such assessment.
2.2 This standard does not purport to address safety
issues, if any, associated with its use. It is the
responsibility of the users of this standard to establish
appropriate safety health practices and determine the
applicability or regulatory limitations prior to use.
3 Limitations
3.1 This test method is primarily intended to determine
the frequency of occurrence (surface density) and
identity of microscopic surface defects, down to a size
range of ≥ approximately 0.1 micrometer, that may be
detrimental to high purity gas distribution systems.
Such defects may not be identifiable by visual or
magnified optical inspection, but concentrations of
microscopic surface defects may cause visually
apparent defects such as haze.
3.2 This test method requires sectioning of the
specimen(s) used for test purposes and is therefore
destructive.
3.3 The method must be applied to representative
examples of process lots to determine quality of the
processes employed and/or lots processed. As the areas
examined and measured by this method are very small,
the results may not be representative of all areas or all
lots processed.
3.4 This test method may be subject to operator bias in
selection of representative areas and definition of
countable defects.
3.5 Detection of countable defects is affected by
operator selection of SEM operating conditions and
image recording conditions. This test method assumes
that the operator is sufficiently proficient in operation
of the SEM to minimize this limitation, per instructions
in the procedures.
3.6 SEM imaging will reveal surface finish flaws, but
may not show features that are well rounded by an
electropolishing or other surface leveling process.
3.7 Energy dispersive X-ray spectroscopy (EDS) may
be used in this test method to analyze surface
contaminants at least approximately one micrometer in
thickness and inclusions at least approximately one
micrometer in size. EDS is not an appropriate
technique for analysis of the oxide passive layer on the
stainless steel surface, as EDS analyzes down to a depth
of the order of 1 micrometer below the surface, and the
oxide passive layer is only 0.001 to 0.01 micrometer
deep.