semi合集-English.pdf - 第4152页
SEMI F64-0701 © SEMI 2001 14 For exam ple (see Table A1–1), i f Q N = 50.01 sccm , Q max = 55.23 sccm, an d Q min = 46.28 sccm , t hen δ Q + = 55.23 sccm - 50.01 sccm = 5.22 sccm δ Q - = 46.28 sccm - 50.01 sccm = -3.73 s…
SEMI F64-0701 © SEMI 200113
APPENDIX 1
NOTE: The material in this appendix is an official part of SEMI F64 and was approved by full letter ballot procedures on April
30, 2001 by the Facilities Regional Standards Committee.
A1–1 Data Analysis: Method A-1
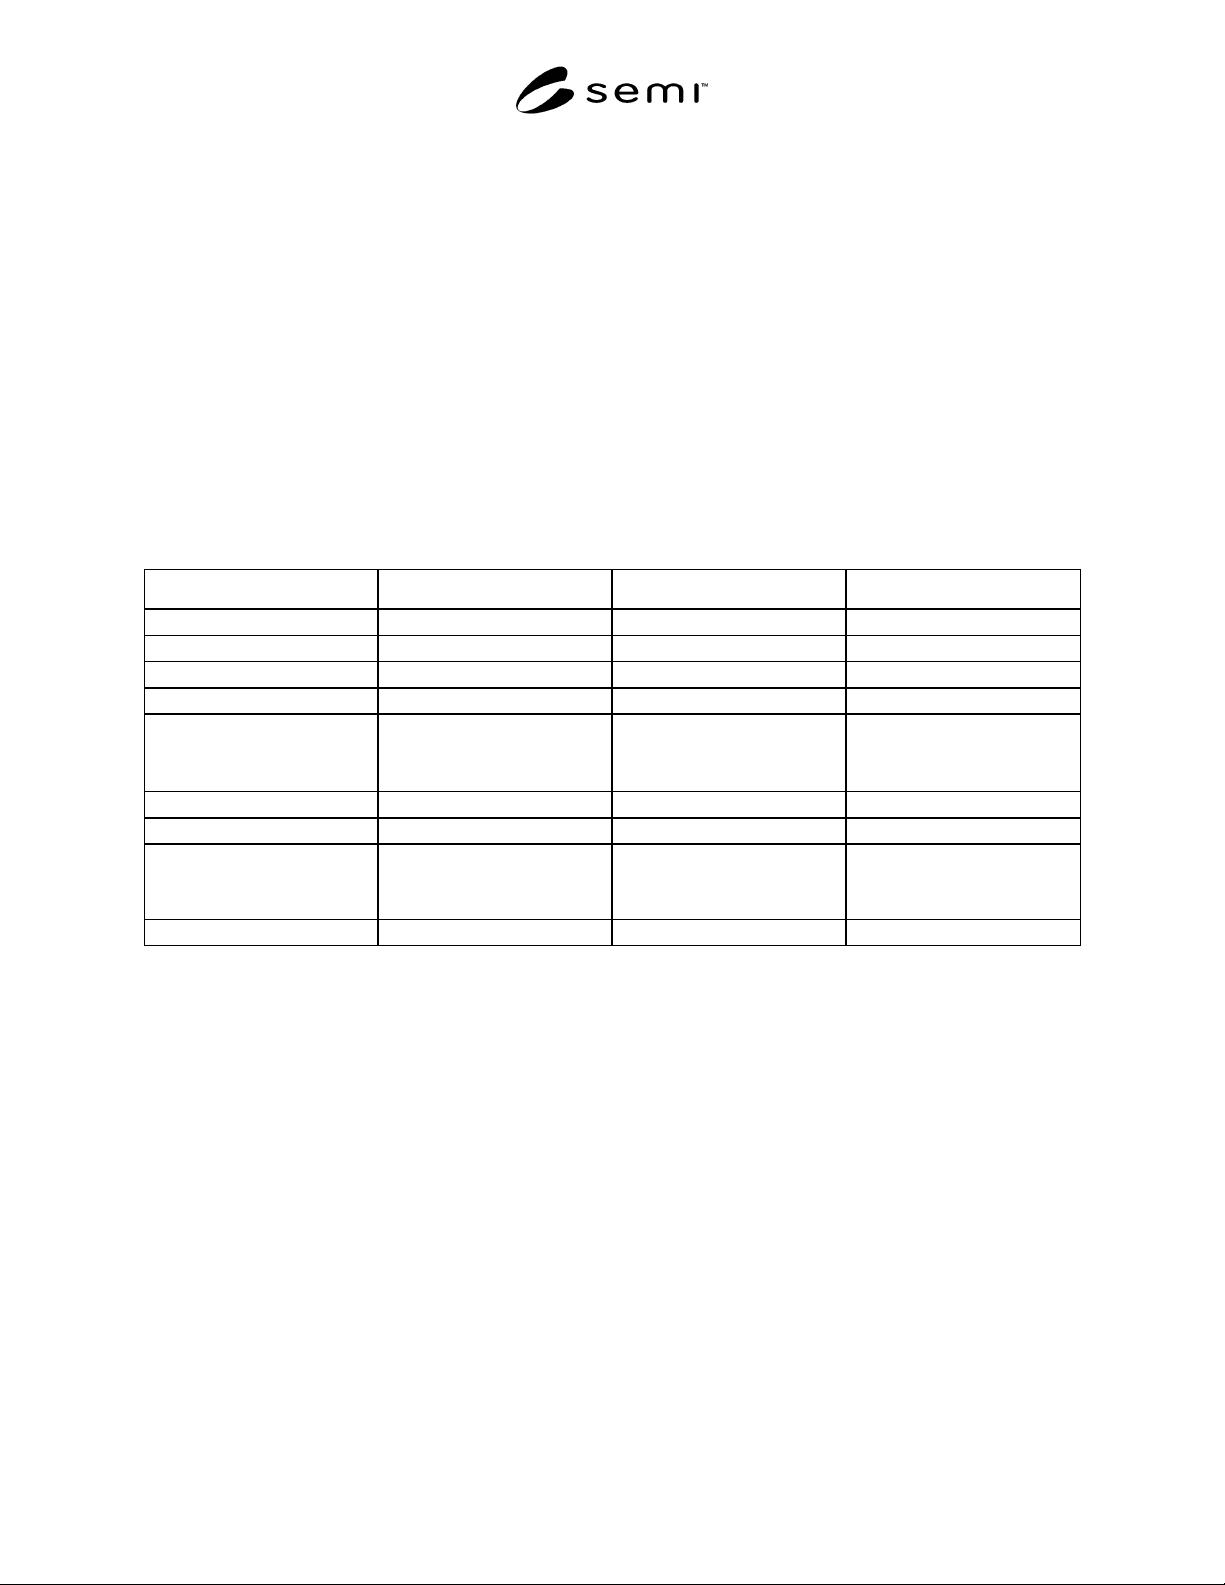
Table A1–1 Sample Data Sheet: Methods A-1 and A-2
Date: ________________ Time: __________
D.U.T. # ________________ Ambient Temp __________°C
Standard Flow Device:________________
Full Scale:________________ sccm
Ramp Rate (Method A-2) ______________kPa/sec
Time (sec) P1 (psig) Q
A
(sccm) Q
I
(sccm)
0 25.01 50.00 50.01
0.05 25.01 50.01 50.01
0.10 25.02 50.00 50.02
0.15 25.01 49.99 50.01
.
.
.
.
.
.
.
.
.
.
.
.
2.20 25.40 52.68 51.38
2.25 25.85 55.23 52.56
.
.
.
.
.
.
.
.
.
.
.
.
6.30 26.89 46.28 49.23
A1–1.1 Data Interpretation, Method A-1
A1–1.1.1
δ
Q
+
= maximum positive deviation of actual flow from nominal
δ
Q
+
= Q
max
- Q
N
where:
Q
max
= maximum value of Q
A
Q
N
= average value of Q
A
during time when P
1
= initial steady state
δ
Q
-
= maximum negative deviation of actual flow from nominal
δ
Q
-
= Q
min
- Q
N
where:
Q
min
= minimum value of Q
A
SEMI F64-0701 © SEMI 2001 14
For example (see Table A1–1), if Q
N
= 50.01 sccm, Q
max
= 55.23 sccm, and Q
min
= 46.28 sccm, then
δ
Q
+
= 55.23 sccm - 50.01 sccm = 5.22 sccm
δ
Q
-
= 46.28 sccm - 50.01 sccm = -3.73 sccm
A1–1.1.2 t
s
is settling time to Q
N
; i.e.,
t
s
= elapsed time from initiation of pressure transient (t
o
) to when Q
A
is within 0.5% of
reading of Q
N
(t
f
) = t
f
- t
o
δ
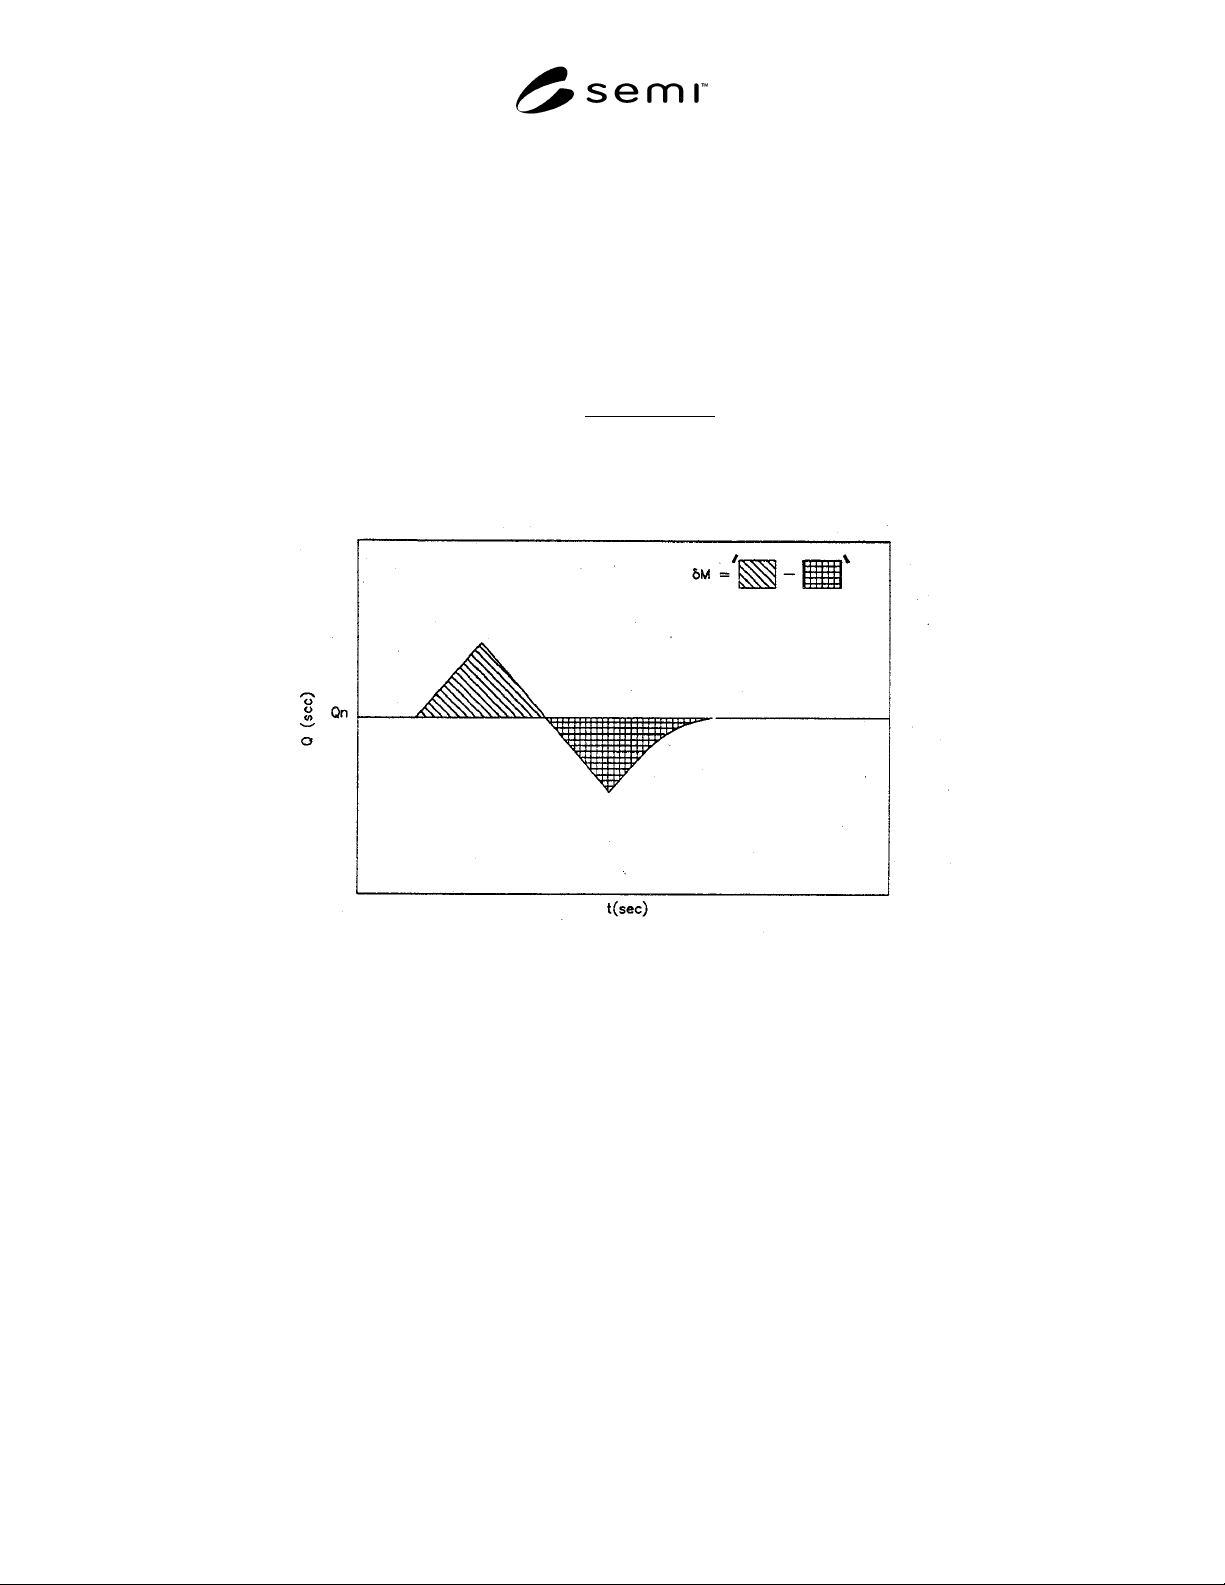
M is deviation of mass of material delivered during the disturbance relative to steady state mass delivery; i.e.,
min/sec 60
)
t
-
t
()
Q
-
Q
(
= M
iih
NA
t
t
=
t
f
oi
δ
(2)
This quantity may be thought of as the net area between the Q
A
versus time curve and the Q
N
versus time line. See
Figure A1–1 below.
Figure A1–1
Q
N
versus t (sec)
NOTE 1:
δ
M is expressed in units of sccm.
A1–2 Data Analysis: Method A-2
Refer again to Table A1–1
A1–2.1 Data Interpretation, Method A-2
Q
R
is the steady state actual flow while the inlet pressure is being ramped. It is calculated by averaging Q
A
values from time t
o
+ 50 sec to t
o
+ 110 sec.
∆Q is the steady state deviation of actual flow during the inlet pressure ramp from that while inlet pressure
is constant; i.e.,
∆Q = Q
R
- Q
N
(3)
SEMI F64-0701 © SEMI 200115
V
eq
is the equivalent internal control volume of the DUT. Note that it may not represent the actual internal volume
of the DUT; i.e.,
)
min/sec 60
atm i/std. s p 14.7
(x
P
Q
=
V
1
eq
∆
(4)
For example, if ∆Q = 5.02 sccm and P1 = 0.7 kPa (0.1 psi)/sec, then
Veq = [(5.02 sccm)/( 0.7 kPa (0.1 psi)/sec)] × [(101.325 kPa (14.7 psi)/std. atm)/(60 sec/min)] = 12.3 ccm
A1–3 Data Analysis: Method B
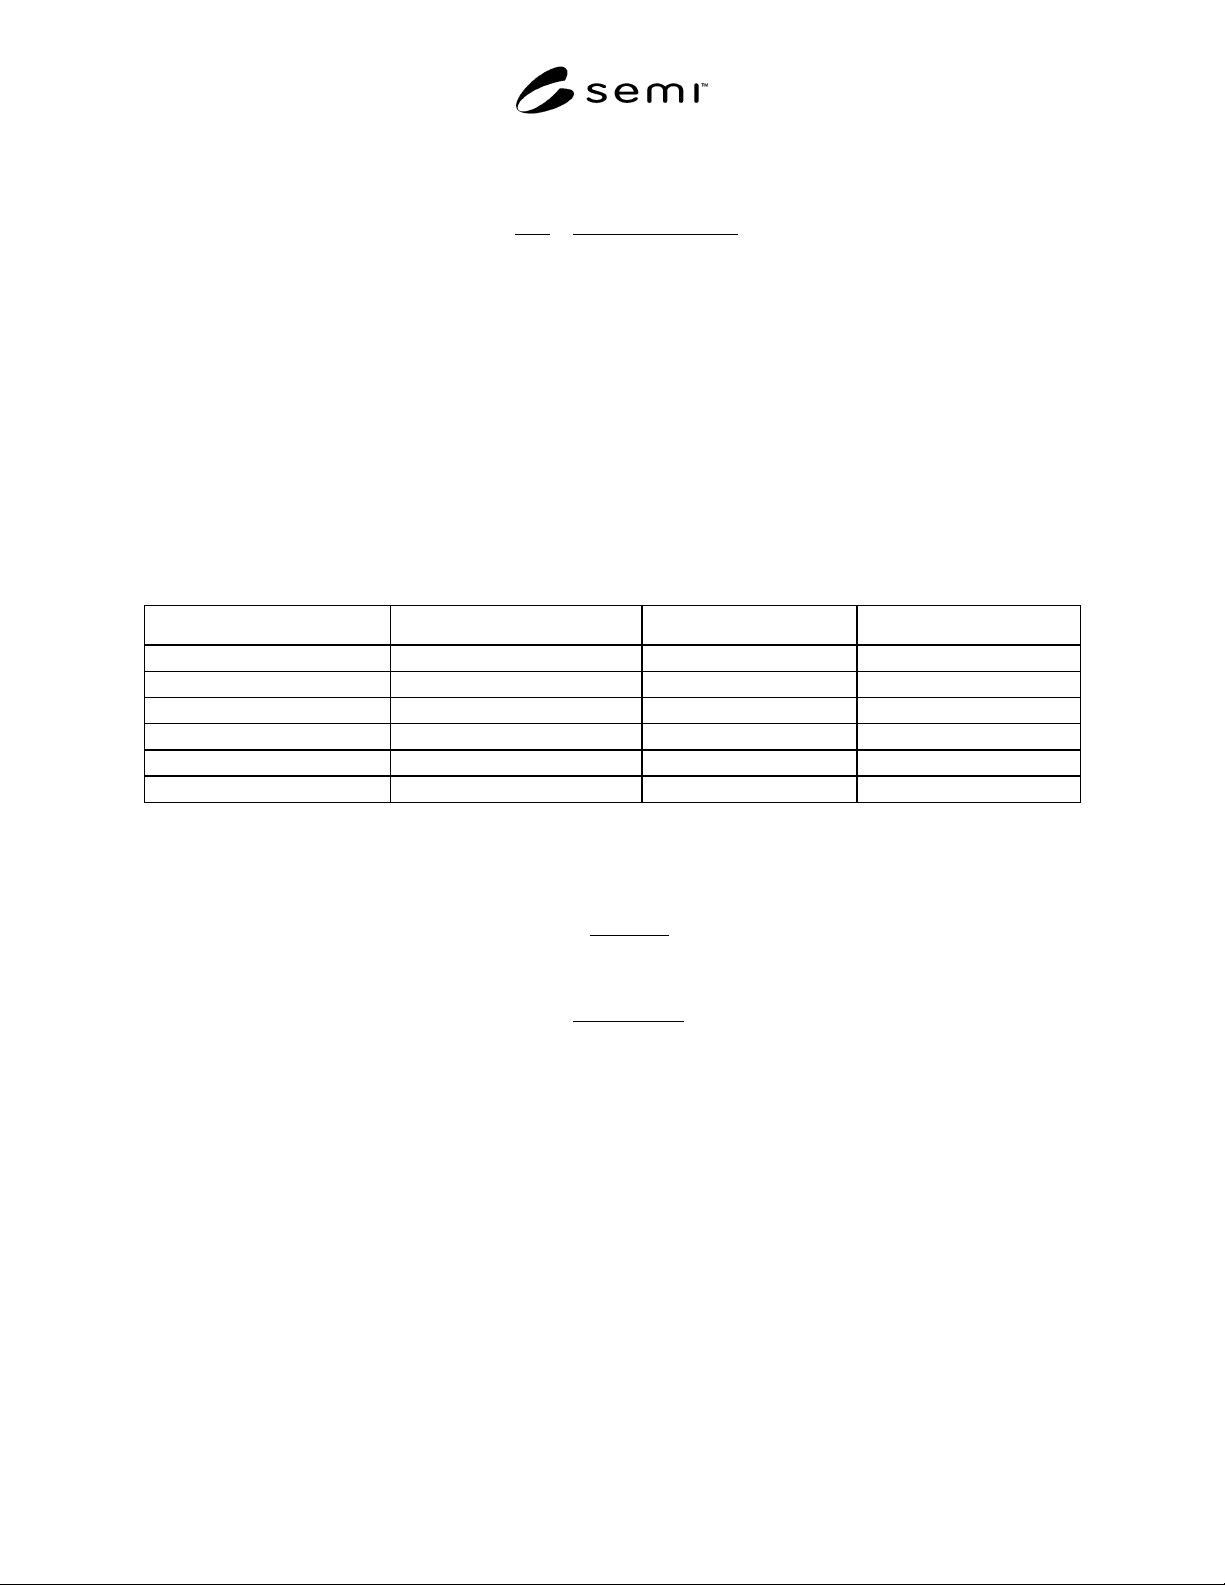
Table A1–2 Sample Data Sheet: Method B
Date:________________ Time: __________
DUT #________________ Ambient Temp __________°C
Standard Flow Device ________________
Full Scale________________ sccm
P1 (psig) Setpoint Flow (sccm) Q
A
(sccm) Q
I
(sccm)
15.02 0 0.00 -0.01
15.00 50 50.01 50.01
15.01 100 100.12 100.01
50.06 0 0.00 -0.05
50.04 50 50.12 50.01
50.03 100 100.56 100.02
A1–3.1 Data Interpretation, Method B
PC
o
is the pressure coefficient of indicated flow per pressure change at zero flow; i.e.,
100
Q
P
Q
= (%)
PC
sp
1
A
A
x
∆
∆
(5)
x100
Q
)
P
-
P
(
Q
-
Q
= (%)
PC
FS
IiIf
IiIf
o
(6)
PC
A
is the pressure coefficient of actual flow per pressure change at a setpoint; i.e.,
For example, from Table A2.1,
PC
o
(%) = {[-0.05 sccm-(-0.01 sccm)]/[(50.06 psig-15.02 psig)(100 sccm)]} × 100
= -0.0011% of FS/psi
PC
A
(@ 50%) = [50.12 sccm-50.01 sccm]/[(50.04 psig-15.00 psig)(50 sccm)] × 100
= 0.0063% of reading/psi at 50 sccm
PC
A
(@ FS = [100.56 sccm-100.12 sccm]/[(50.03 psig-15.01 psig)(100 sccm)] × 100
= 0.013% of reading/psi at 100 sccm