semi合集-English.pdf - 第3933页
SEMI F35-0304 © SEMI 1998, 2004 7 17.6.1 When T ool-1, Tool-2, or Tool-3 demands gas, the O 2 reading drops in propo rtion to the total flow of gas in the lateral line. The high er flow rates act to dilute the effects of…
SEMI F35-0304 © SEMI 1998, 2004 6
16.6 Perform an investigative O
2
measurement (spot
check) with a portable O
2
analyzer at each lateral
location that is suspected in causing contamination in
the main or sub-main line which supplies the lateral
where the contamination was originally detected. Work
upstream away from the lateral which showed a sign of
contamination.
16.7 Once the lateral with the contamination source has
been identified, use the steps outlined in Sections 16.3
and 16.4 to locate the exact point of the atmospheric
leak source.
16.8 Refine the selection of investigative sample point
locations along with a careful study of system flow
dynamics until the leak is pinpointed and repaired.
16.9 Confirm that the leak source has been corrected
by providing an investigative O
2
measurement
downstream of the leak source.
17 Example in Locating Leak Source
17.1 See Figure 1 which is a schematic representation
of a typical fab branching type gas distribution system.
Since a loop type gas distribution system has one less
piping level between the main line and the tools, it is
more straightforward to monitor and diagnose. This
example, although more complex, has been
demonstrated in practice. It shows how an atmospheric
leak originating at a single tool location can back-
contaminate a sub-main distribution line, yet not
contaminate all the way back to the main line. In this
example, the contamination would not be detected by
the UHP analysis instrumentation typically installed on
the main line.
17.2 The “contaminant signature” oxygen analyzers are
installed at critical purity locations, shown in Figure 1
as A
1
, A
2
, and A
3
. These analyzers show baseline
“contaminant signature” O
levels of 0.2–0.5 ppb. By
definition, as established by the user for each critical
purity location, these are normal contaminant levels at
these locations.
17.2.1 A
2
and A
3
begin showing excursions up to 1–2
ppb that last for several minutes, then settle back into
the normal 0.2–0.5 ppb range. The excursions take
place infrequently at first, but then develop some
regularity. Although the absolute O
2
level detected does
not yet indicate that the potential atmospheric leak
(H
2
O and N
2
included) would pose a direct risk to the
critical purity of process tools located nearby, it does
differ significantly from the baseline “contaminant
signature”. This prompts an investigation before a full-
scale process production problem results.
17.2.2 Each of the lateral lines being monitored by A
2
and A
3
shows the same level of O
2
contamination, so it
is deduced that the contamination is coming from the
sub-main line which feeds both laterals. Since analyzer
A
1
does not show the contamination, it is further
deduced that the leak source is located between A
1
and
A
2
.
17.3 Working back upstream along the sub-main,
investigative O
2
measurements are made at each lateral
location ahead of the A
2
lateral. These investigative O
2
measurements are made using a portable O
2
analyzer
per Sections 12 and 13.
17.4 At S
1
and S
2
, similar O
2
contamination events are
observed as compared with points A
2
and A
3
. Further,
no lateral line flow changes (due to tool gas demand
cycles in those laterals) cause any change in the O
2
level.
17.5 At the third lateral, sampled as S
3
in Figure 1, the
O
2
level is significantly higher (ranging between 5–10
ppb), with periodic spikes of 50–100 ppb. At this point,
it is observed that when the usage in lateral S
3
drops to
zero (a dead leg condition), analyzers A
2
and A
3
show
O
2
readings above the “contaminant signature”. It is
therefore deduced that the S
3
lateral is the source of the
atmospheric leak.
17.6 By correlating the O
2
data at S
3
with the gas usage
from the tools on this lateral, the leak source can be
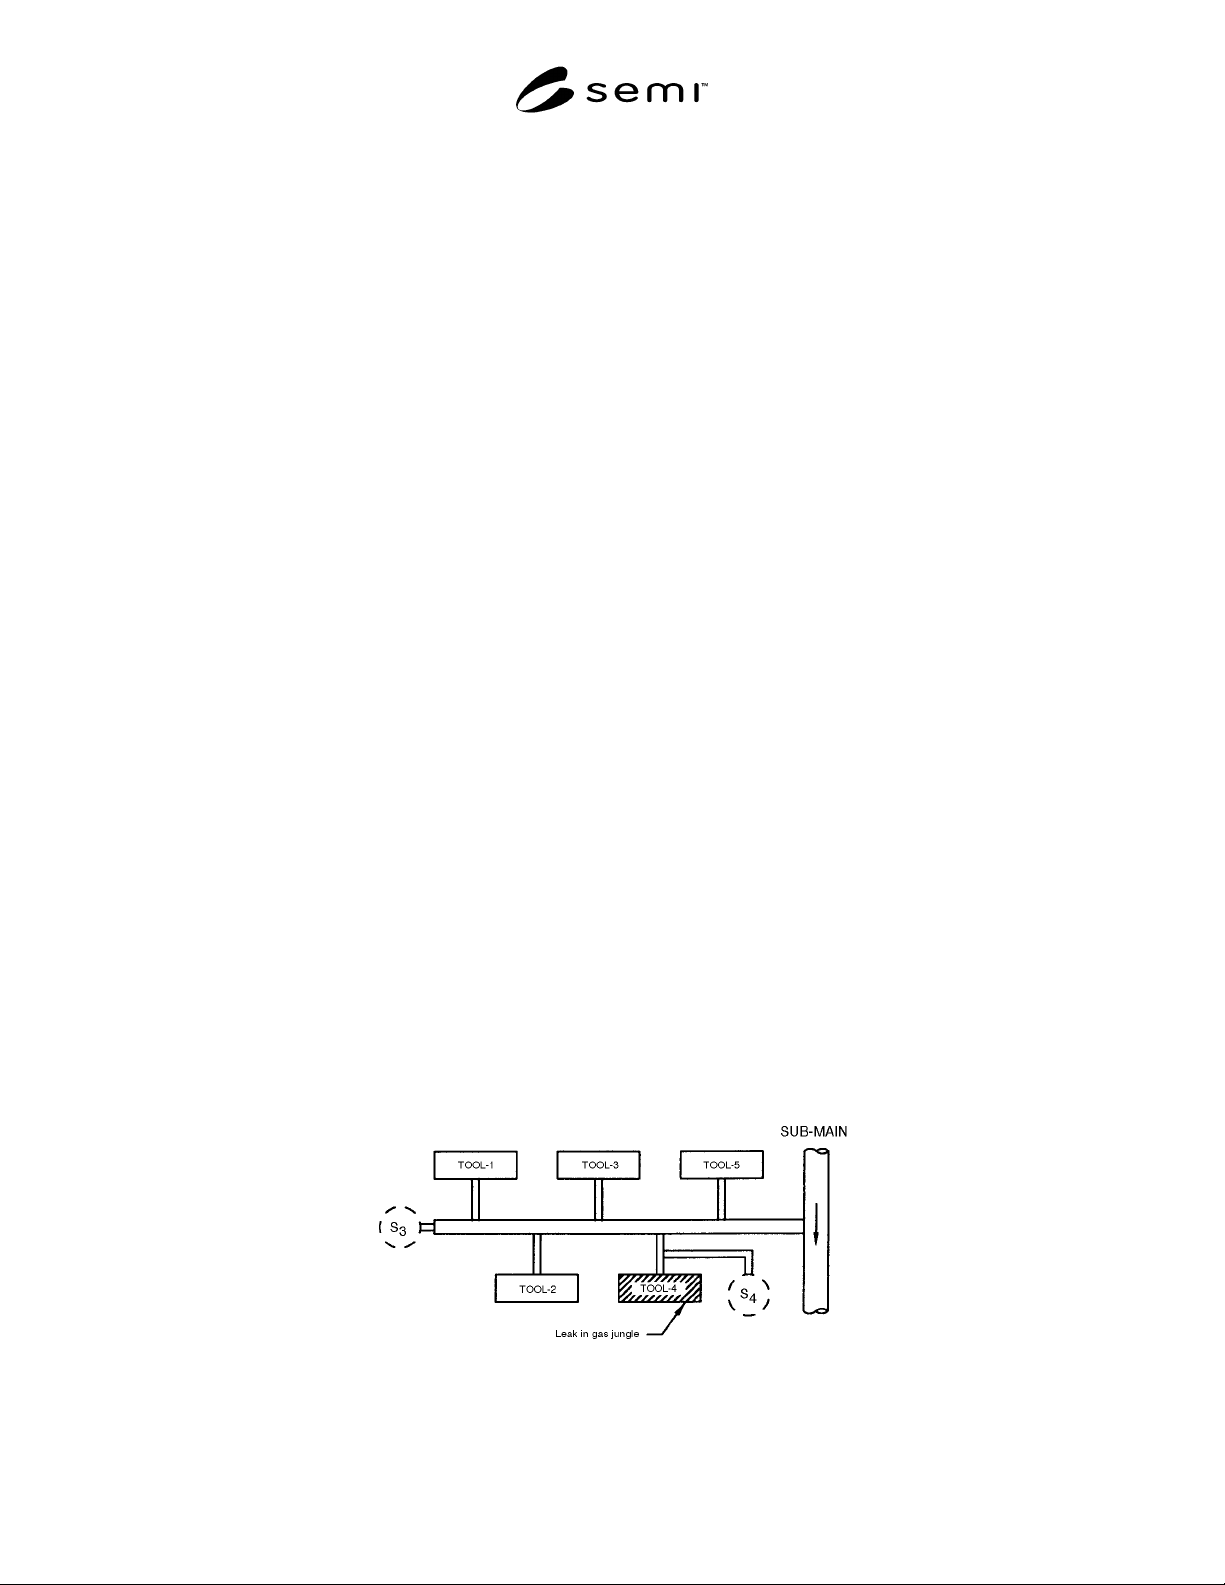
further traced within this lateral. (Refer to Figure 2.)
Figure 2
Branch UHP Gas Line with Ambient Air Leak Contaminating Sub-Main Line

SEMI F35-0304 © SEMI 1998, 2004 7
17.6.1 When Tool-1, Tool-2, or Tool-3 demands gas,
the O
2
reading drops in proportion to the total flow of
gas in the lateral line. The higher flow rates act to dilute
the effects of the leak source and thus lower the O
2
reading at S
3
.
17.6.2 It is observed that when Tool-5 demands gas,
there is no change in the O
2
reading at S
3
. Therefore, it
is deduced that the leak source is located further out
along the lateral line.
17.6.3 When Tool-4 demands gas, it causes a more
significant drop in the O
2
reading at S
3
. Further, it is
observed that the time required for the analyzer to
respond after Tool-4 begins demanding gas correlates
to the time needed for the analyzer’s sample flow alone
to purge down the lateral line volume up to the
analyzer, when Tool-1, -2, and -3 are not demanding
gas.
17.6.4 This deductive inference technique pinpoints the
leak source to the Tool-4 lateral line.
17.6.5 After Tool-4 has stopped demanding gas (yet
before any other Tools on this lateral demand gas), the
O
2
reading at S
3
continues to drop gradually over
several minutes. It then gradually begins to elevate once
again. This indicates that the actual leak is not very
close to the connection of Tool-4 at the lateral line. It
suggests more that the leak source is closer to the tool
itself.
17.7 A final investigative sample point is selected
along the line leading to Tool-4. This is shown as S
4
in
Figure 2. It is observed that the O
2
readings drop to
0.2–0.5 ppb when Tool-4 demands gas. S
4
begins to
show an O
2
elevation after the Tool-4 stops demanding
gas. This concludes that the leak source is originating
from Tool-4 itself.
18 Related Documents
18.1 SEMI Standard
SEMI E49.8 — Guide For High Purity And Ultrahigh
Purity Gas Distribution Systems In Semiconductor
Manufacturing Equipment
NOTICE: Unless otherwise indicated, all documents
cited shall be the latest published versions.
NOTICE: SEMI makes no warranties or
representations as to the suitability of the standards set
forth herein for any particular application. The
determination of the suitability of the standard is solely
the responsibility of the user. Users are cautioned to
refer to manufacturer’s instructions, product labels,
product data sheets, and other relevant literature
respecting any materials mentioned herein. These
standards are subject to change without notice.
The user’s attention is called to the possibility that
compliance with this standard may require use of
copyrighted material or of an invention covered by
patent rights. By publication of this standard, SEMI
takes no position respecting the validity of any patent
rights or copyrights asserted in connection with any
item mentioned in this standard. Users of this standard
are expressly advised that determination of any such
patent rights or copyrights, and the risk of infringement
of such rights, are entirely their own responsibility.
Copyright by SEMI® (Semiconductor Equipment and Materials
International), 3081 Zanker Road, San Jose, CA 95134. Reproduction o
f
the contents in whole or in part is forbidden without express written
consent of SEMI.

SEMI F36-0299 (Reapproved 1104)
GUIDE FOR DIMENSIONS AND CONNECTIONS OF GAS
DISTRIBUTION COMPONENTS
This standard was technically approved by the Global Gases Committee and is the direct responsibility of the
North American Gases Committee. Current edition approved by the North American Regional Standards
Committee on July 11, 2004. Initially available at www.semi.org September 2004; to be published
November 2004. Originally published in 1993; last published February 1999.
1 Purpose
1.1 The purpose of this guide is standardization of
dimensional and mechanical/electrical connection
attributes for components used within gas distribution
systems. Standardization of these component interfaces
will allow for interchangeability of gas distribution
system components. Filters/purifiers, shut-off valves,
pressure regulators, MFC/MFMs, and pressure
transducers are the types of gas distribution components
that would benefit from being interchangeable.
2 Scope
2.1 This guide is for use with 1/4-inch distribution
systems at operating pressures no greater than 345 kPa
(50 psi).
2.2 The guide includes the following items:
2.2.1 Physical characteristics specific to each
component. These include a generalized drawing of the
component, specific end-to-end lengths for each type of
end connection, maximum envelope dimensions, base-
to-centerline dimensions, tolerances, and bottom
mounting information.
2.2.2 Electrical connections specific to each
component, where applicable. These include pin-outs
and types of connectors.
NOTICE: This standard does not purport to address
safety issues, if any, associated with its use. It is the
responsibility of the users of this standard to establish
appropriate safety and health practices and determine
the applicability of regulatory or other limitations prior
to use.
3 Limitations
3.1 This guide is not intended to dictate how to build a
gas distribution system, but to allow for
interchangeability of components.
3.2 This standard does not include recommendations
for sensor-bus compliant interfaces.
3.3 This standard does not apply to surface mount
components used in modular type gas systems.
4 Referenced Standards
4.1 None.
5 Terminology
5.1 Definitions
5.1.1 component
an individual piece or a complete
assembly of individual pieces capable of being joined
with other pieces or components.
5.1.2 filter a porous device, generally constructed of
polymer, metal, or ceramics and housed in a metal
chamber, which traps particles, preventing them from
being transported downstream.
5.1.3 mass flow controller (MFC) a self-contained
device (consisting of a transducer, control valve, and
control and signal-processing electronics) commonly
used in the semiconductor industry to measure and
regulate the mass flow of gas.
5.1.4 mass flow meter (MFM) a self-contained
device, consisting of a mass flow transducer and signal-
processing electronics, commonly used in the
semiconductor industry to measure the mass flow of
gas.
5.1.5 pressure regulator a valve designed to reduce
a high incoming pressure (for example, from a cylinder)
to a lower outlet pressure by automatically opening to
allow flow until a desired, preset pressure on the outlet
side is reached, then automatically throttling closed to
stop further pressure increase.
5.1.6 pressure transducer
a component which
mechanically or electrically senses gas pressure. It
typically consists of a sensor and signal-processing
electronics which enables remote indication of gas
pressure.
SEMI F36-0299 © SEMI 1999, 2004 1