semi合集-English.pdf - 第5317页
SEMI M50-1104 © SEMI 2001, 2004 3 repeat LLS events on the wafer, M 2 , is larger than 0.75 M 1 . Make certain that the conditio ns of Sections 8.1 and 8.1.1 are fulfilled for both wafer scans. 9.2 Scan the wafer a total…

SEMI M50-1104 © SEMI 2001, 2004 2
5.1.4 false count (FC) — laser-light scattering event
that arises from instrumental causes rather than from
any feature on or near the wafer surface; also called
false positive.
5.1.4.1 Discussion — False counts would not be
expected to occur at the same point on the wafer surface
during multiple inspection scans, and hence they could
be considered as random “noise” that could be identi-
fied by examining the results of repeated scans.
5.1.5 false count rate (FCR) — mean total number of
false counts per wafer that an SSIS reports at some
specified SSIS operational setting.
5.1.6 repeat counts — LLSs that are found in a later
scan within the scanner XY uncertainty distance of their
location as found on an earlier scan.
5.1.6.1 Discussion — The implication is that if defect
density is low enough, then a repeat count results from
detecting the same LLS event again and is not the result
of SSIS noise. Besides the absolute position of the
LLS, an additional matching condition may be the LSE
signal of the LLS.
5.1.7 scanner XY uncertainty — square root of the
sum of the squares of the one-sigma standard deviations
in the reported X and Y locations of the SSIS under test,
as determined under repeatability conditions.
5.1.8 true count — laser-light scattering event that
arises from the localized light scatterers (LLS) being
investigated.
6 Summary of Method
6.1 The XY coordinate uncertainty of the SSIS under
test is either known or determined under repeatability
conditions, without removing the wafer from the stage
between scans.
6.2 The reference wafer to be used in this test is
selected.
6.3 The selected wafer is scanned Z times on the SSIS
under test. The first two scans are used to qualify the
reference wafer before continuing with the remaining
Z2 scans.
NOTE 2: Typical values for Z are between 30 and 100 scans.
6.4 The scans are analyzed to determine and record the
number of times each LLS event occurs in each
location (to within a distance approximately six times
the scanner XY uncertainty) during the Z scans. The
capture rate, standard size deviation, false count rate,
and cumulative false count rate are determined from
this data set.
7 Apparatus
7.1 SSIS under test — installed in its position of use
with clean room rating recommended by the
manufacturer.
7.2 Off-line analysis software program — to track each
observed count and determine the capture rate, standard
size deviation, the number of false counts at each LLS
size, the false count rate, and the cumulative false count
rate.
NOTE 3: The analysis software may be incorporated into the
SSIS, if desired.
8 Test Specimens
8.1 Use any wafer with (1) natural LLS with density
<10 LLS/cm
2
and (2) a surface roughness typical of the
wafers to be measured in production (see Section 2.3).
8.1.1 The minimum distance between any two LLS
found during any one scan and used in the data set to be
analyzed shall be larger than six times the scanner XY
uncertainty. Clusters of LLS (found in any one scan
and closer together than six times the scanner XY
uncertainty) and scratches must be excluded during the
analysis.
8.1.2 Determine the scanner XY uncertainty from
previous knowledge, from the scanner manufacturer
specifications, or from the positional accuracy
determined under repeatability conditions in accordance
with Appendix 1.
8.2 Alternatively, a wafer with deposited polystyrene
latex spheres can be used to evaluate the capture rate
more accurately at a specific particle size. The same
particle density, particle spacing, and defect cluster
conditions as in Section 8.1 should be observed.
NOTE 4: The wafer with deposited PSL spheres may or may
not be certified reference material.
9 Procedure
9.1 Qualify the wafer for appropriate LLS number (see
Section 8.1) prior to taking CR and CFCR data as
follows:
9.1.1 Scan the wafer once and determine position, P
m
,
and size, S
m,
of each of the M
1
detected LLS events with
m = [1, 2, … M
1
].
9.1.2 To determine that there are enough repeating
LLS events to make the CR calculation meaningful,
scan the wafer a second time and compare the detected
LLS events with respect to the positions of those
detected during the first scan. Define the total number
of LLS events that repeat their position in the first scan
to within six times the scanner XY uncertainty as M
2
.
Consider the wafer qualified for the test if the share of

SEMI M50-1104 © SEMI 2001, 2004 3
repeat LLS events on the wafer, M
2
, is larger than 0.75
M
1
. Make certain that the conditions of Sections 8.1
and 8.1.1 are fulfilled for both wafer scans.
9.2 Scan the wafer a total of Z times to obtain CR,
FCR, and CFCR data (see NOTES 3 and 6). Record
each LLS event detected during the Z scans according
to its position P and size S.
NOTE 5: The two scans obtained in Sections 9.1 through
9.1.2 can be used as part of this data set, but the wafer must
remain on the scan stage during the entire set of Z scans to
perform the measurement sequence under repeatability
conditions.
10 Analysis
10.1 Initial Analysis
10.1.1 Determine the locations on the wafer where an
LLS event has been detected at least once by comparing
all recorded positions (within the constraint of the six-
sigma XY uncertainty) of the multiple scans as reported
by the SSIS. These locations, L
i
, with i = [1, 2, …,N]
represent the complete set of LLS events to be used in
the analysis. Each location is characterized by the
number of scans H
i
, in which the LLS event at that
position has been detected, and by the H
i
reported sizes
S
ih
, where h = [1, 2, …,H
i
], for the LLS event.
10.1.2 Consider those of the N events with H
i
= 1, (i.e.,
events seen only once) as false counts. Order these
events by decreasing size, S
i
. Index them by f = [1, 2,
...,F], with f = 1 representing the largest size and f = F
representing the smallest.
10.1.3 Consider those events that were seen at least
twice during the Z scans (H
i
2) to be true counts.
NOTE 6: The sequence of analysis steps given below is
intended to be representative and illustrative. The actual
algorithms used in the analysis software may differ from these
as long as the same result is achieved.
10.2 Analysis of True Counts
10.2.1 Determine the average size <S
i
> of each true
count (H
i
2) as follows:
i
H
h
ih
i
i
S
H
S
1
1
(1)
10.2.2 Calculate the size dependent capture rate,
CR(<S
i
>), for every true count as follows:
Z
H
SCR
i
i
)( (2)
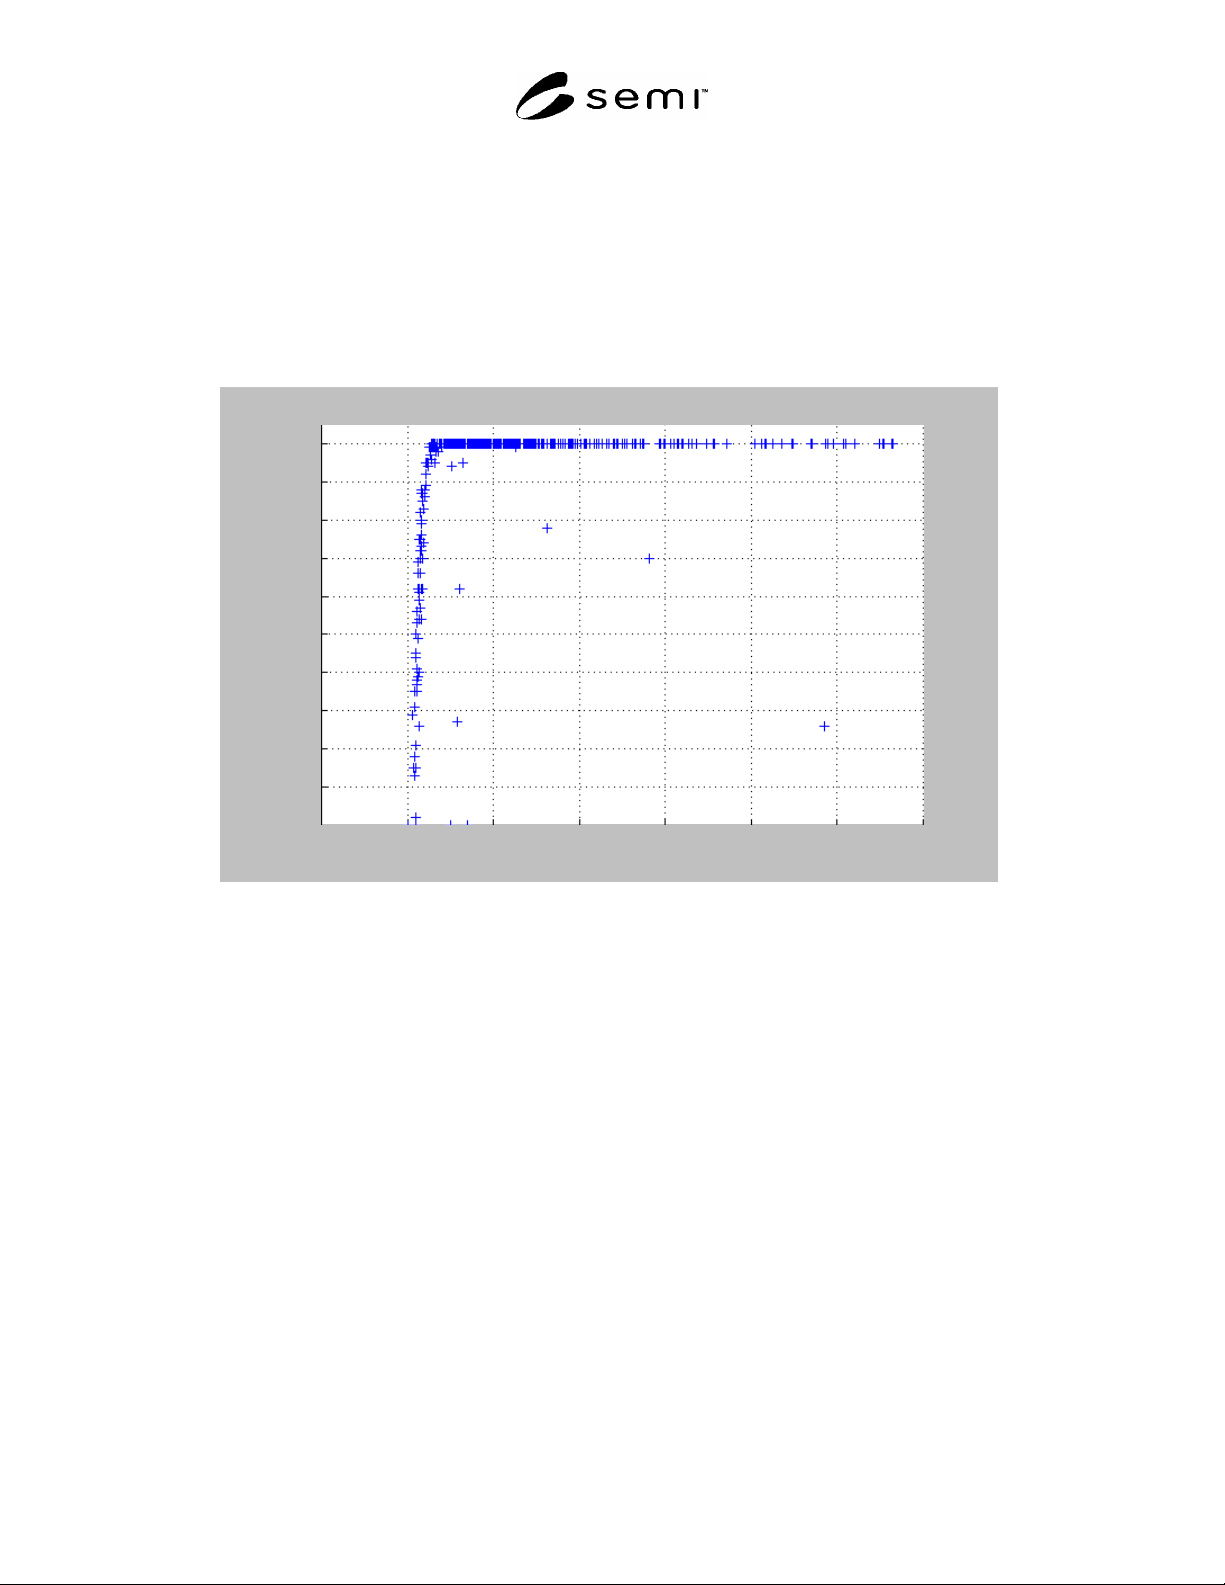
10.2.3 Plot CR(<S
i
>) versus <S
i
> as in the example in
Figure 1, and interpolate or fit the data to discriminate
against outlying points.
NOTE 7: The following equation for c
s,
in percent,
0
0
exp1100
c
ss
c
s
, (2a)
may be used to fit the plotted CR(<S
i
>) data. Here, c
s
is the
fitted value of CR(<S
i
>), s is the size (<S
i
>), s
0
is the size at
zero probability of capture, and c
0
is a curvature factor that
determines the point at which the probability of capture
approaches 100%. As c
0
and s
0
constitute a sufficient
parameter set to describe completely CR(<S
i
>), they can be
used for reporting, together with the chi-square goodness of
the fit test statistic result.
NOTE 8: Note that there are a few points below the principal
curve in Figure 1. These points may have arisen from added
particles that appeared on the wafer during the test. They
should be neglected in fitting any curve to the capture rate
data.
10.2.4 Calculate the standard deviation of size S
i
for all
true counts as follows:
i
H
h
iih
i
i
SS
H
S
1
2
)(
1
1
)(
(3)
10.2.5 Plot the standard deviation of size, σ(S
i
), versus
the mean size, <S
i
>, for all true counts as shown in the
example in Figure 2.
NOTE 9: Again, note the same outliers in Figure 2. These
can be neglected in any analysis of the standard deviation
data.
10.3 Analysis of False Counts
10.3.1 Divide the total number of false counts, F, by
the number of scans, Z, to get the false count rate, FCR:
Z
F
FCR
(4)
10.3.2 Analyze the false count rate as a function of size
to determine the cumulative false count rate, CFCR(S
i
),
at each size, S
i
, by taking the total number of false
counts of size equal to or greater than S
i
, and dividing
by the number of scans, Z:
,)(
Z
F
SCFCR
i
i
(5)
where F
i
is the largest value of the index associated
with the count (or counts) of size S
i
.
10.3.3 Plot CFCR(S
i
) as a function of S
i
as shown in
the example in Figure 3.
11 Report
11.1 Report the following information:
11.1.1 Operator identification;
SEMI M50-1104 © SEMI 2001, 2004 4
11.1.2 Date of test;
11.1.3 Manufacturer, model, serial number, and
software version of the SSIS being tested,
11.1.4 Description of the reference wafer used in the
test.
11.1.5 Plot of the capture rate, CR(<S
i
>), vs. the mean
size, <S
i
>, similar to the example in Figure 1.
11.1.6 Plot of the standard deviation, (S
i
), of the LLS
mean size, <S
i
>, similar to the example in Figure 2.
11.1.7 Calculated false count rate, FCR, as described in
Section 10.3.2.
11.1.8 Plot of the cumulative false count rate,
CFCR(S
i
), similar to the example in Figure 3.
1
0.9
0.8
0.7
0.6
0.5
0.4
0.3
0.2
0.1
0
70 80 90 100 110 120 130 140
Mean Size <S
i
> of LLS [nm LSE]
Capture Rate CR (<S
i
>) [%/100]
NOTE 1: This figure is an example plot of capture rate as determined in Sections 10.2.1 through 10.2.3. The measurements in
this example are the result of 100 scans on a wafer with several natural LLS sites of different sizes. The SSIS noise floor was set
at 80 nm LSE.
Figure 1
Capture Rate