semi合集-English.pdf - 第7249页
SEMI MF525-0705 © SEMI 2003, 2005 12 and R could b e calculated that would apply t o broad ranges of resi stivity values without further res pect to specim en crystallographic orientatio n or conductivity type. Table R…
SEMI MF525-0705 © SEMI 2003, 2005 11
RELATED INFORMATION 1
ANALYSIS OF DATA FROM THE MULTILABORATORY EXPERIMENT
NOTICE: This related information is not an official part of SEMI MF525. It was derived from information
developed during the original preparation of the standard in ASTM Committee F-1 on Electronics in 1977. This
related information was approved for publication by full letter ballot procedures.
R1-1 In the multilaboratory experiment each laboratory received its own replicate set of specimens. For each
specimen type used, the replicates were approximately 3 by 5 mm chips cut from the central region of a single
wafer. Each laboratory was requested to take and report 4 sets of 25 measurements each, on each of the specimens.
Prior to each set of measurements, each specimen surface was to be reprepared by the participating laboratory's
choice of one of the following procedures: (1) polishing with diamond—either planar polishing the entire specimen
surface against an appropriate polishing pad or bevel polishing a portion of the specimen against a glass plate having
a frosted surface, (2) polishing with silica in an aqueous medium—either the entire specimen surface against an
appropriate polishing pad or on a beveled surface against a hard plastic surface, (3) lapping with alumina or garnet
in water—either the entire specimen surface or on a beveled surface against ground glass or cast iron. Each
laboratory was to report preparation procedure used, probe material used, probe load, all spreading resistance data
and any additional observations thought to be pertinent to the analysis of the multilaboratory test. Since the
experiment was run with parallel sets of specimens, no master calibration specimen set was included. To avoid
possible confusion of analysis due to differing qualities of each laboratory's own calibration specimens, conversion
of data to resistivity values was not required.
R1-2 Table R1-1 summarizes the combinations of resistivity level, conductivity type, and crystallographic
orientation for the specimens used in this multilaboratory test. Table R1-2 summarizes the probe material, probe
load, and specific specimen preparation conditions; entries in this table are organized under general categories of
specimen preparation.
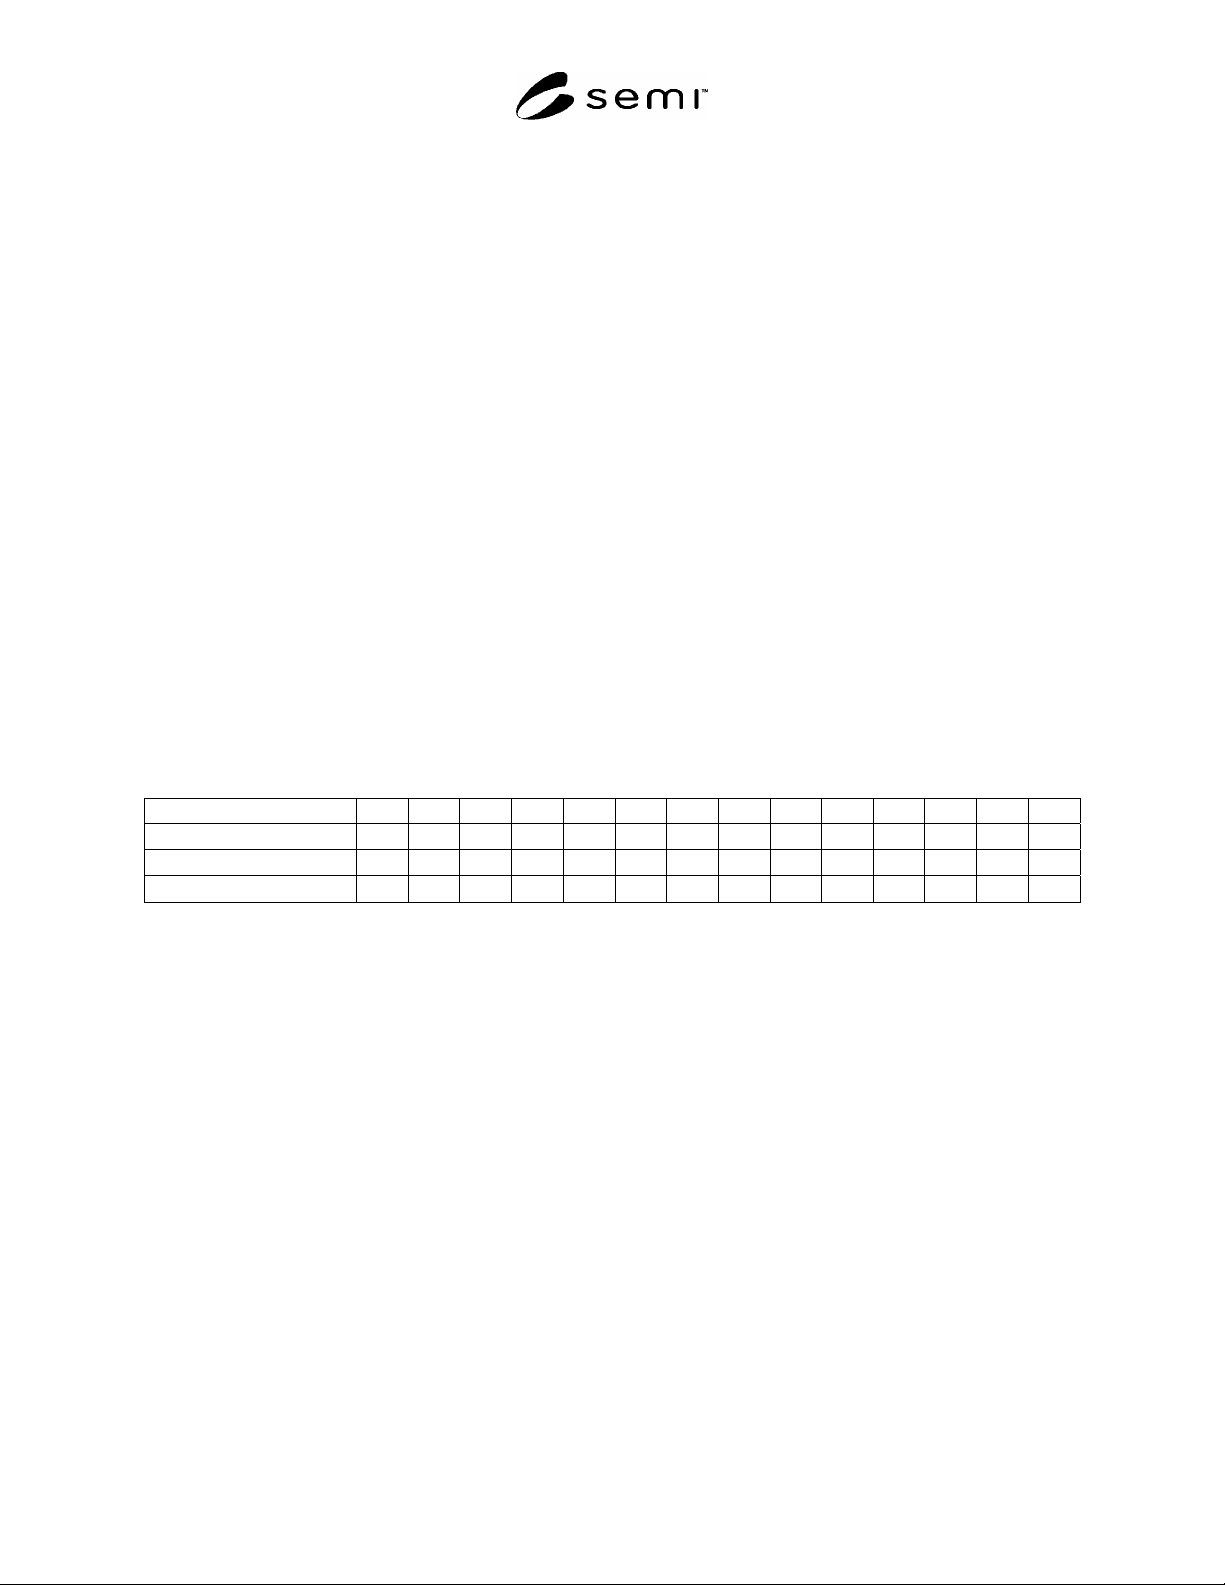
Table R1-1 Description of Silicon Specimens Used in Spreading Resistance Round Robin
Specimen Designation C D E F G H J K L M N P R T
Crystal Orientation (111) (111) (111) (111) (111) (100) (100) (111) (100) (111) (111) (111) (100) (111)
Conductivity Type n p p n p n p n p n n p p n
Nominal Resistivity (·cm)
0.5 10 1500 500 0.5 10 10 0.01 0.01 10 180 0.05 1 75
R1-3 Two quantities were calculated to characterize each laboratory's data on each specimen. The two quantities
are
r
, the average of the relative standard deviations from each set of 25 measurements, and
R
, the standard
deviation of the 4 measurement averages on a given specimen, each expressed as a percent of the overall
measurement average for that lab on that specimen. The first parameter is a measure of the repeatability, or freedom
from scatter, of measurements on a fixed surface, assuming there is no inherent resistivity variation to the specimen
over the area measured; the second parameter is a measure of reproducibility of measured value following
independent specimen preparations and measurements. A summary of values of these parameters, as well as the
grand averages of spreading resistance values are given in Table R1-3. The entries are organized under the general
categories of specimen preparation used. Separate analyses of measurement precision were done for each category
except for lapping with aluminum oxide; for this category there were insufficient data (only one laboratory) for a
reliable analysis. Values of average spreading resistance are listed for completeness of record only; they were not
used for data screening or for formal analysis.
R1-4 A variety of choices of probe load, probe material, and specific details of specimen preparation are found to
occur within each of the general specimen preparation categories. The number of laboratories that used any one
specific set of specimen and probe conditions was too small to allow any reliable estimate of precision to be made
for that set of specific conditions. Several assumptions were made regarding analysis of the data: (1) the data could
be pooled within each general specimen preparation category without further regard for the specific details of
specimen preparation or measurement condition, (2) the results of the analysis would represent estimates of the
precision which could be expected by a laboratory in reasonable control of the spreading resistance instrumentation
and of the chosen type of specimen preparation, and (3) within each specimen preparation category, estimates of
r
SEMI MF525-0705 © SEMI 2003, 2005 12
and
R
could be calculated that would apply to broad ranges of resistivity values without further respect to specimen
crystallographic orientation or conductivity type.
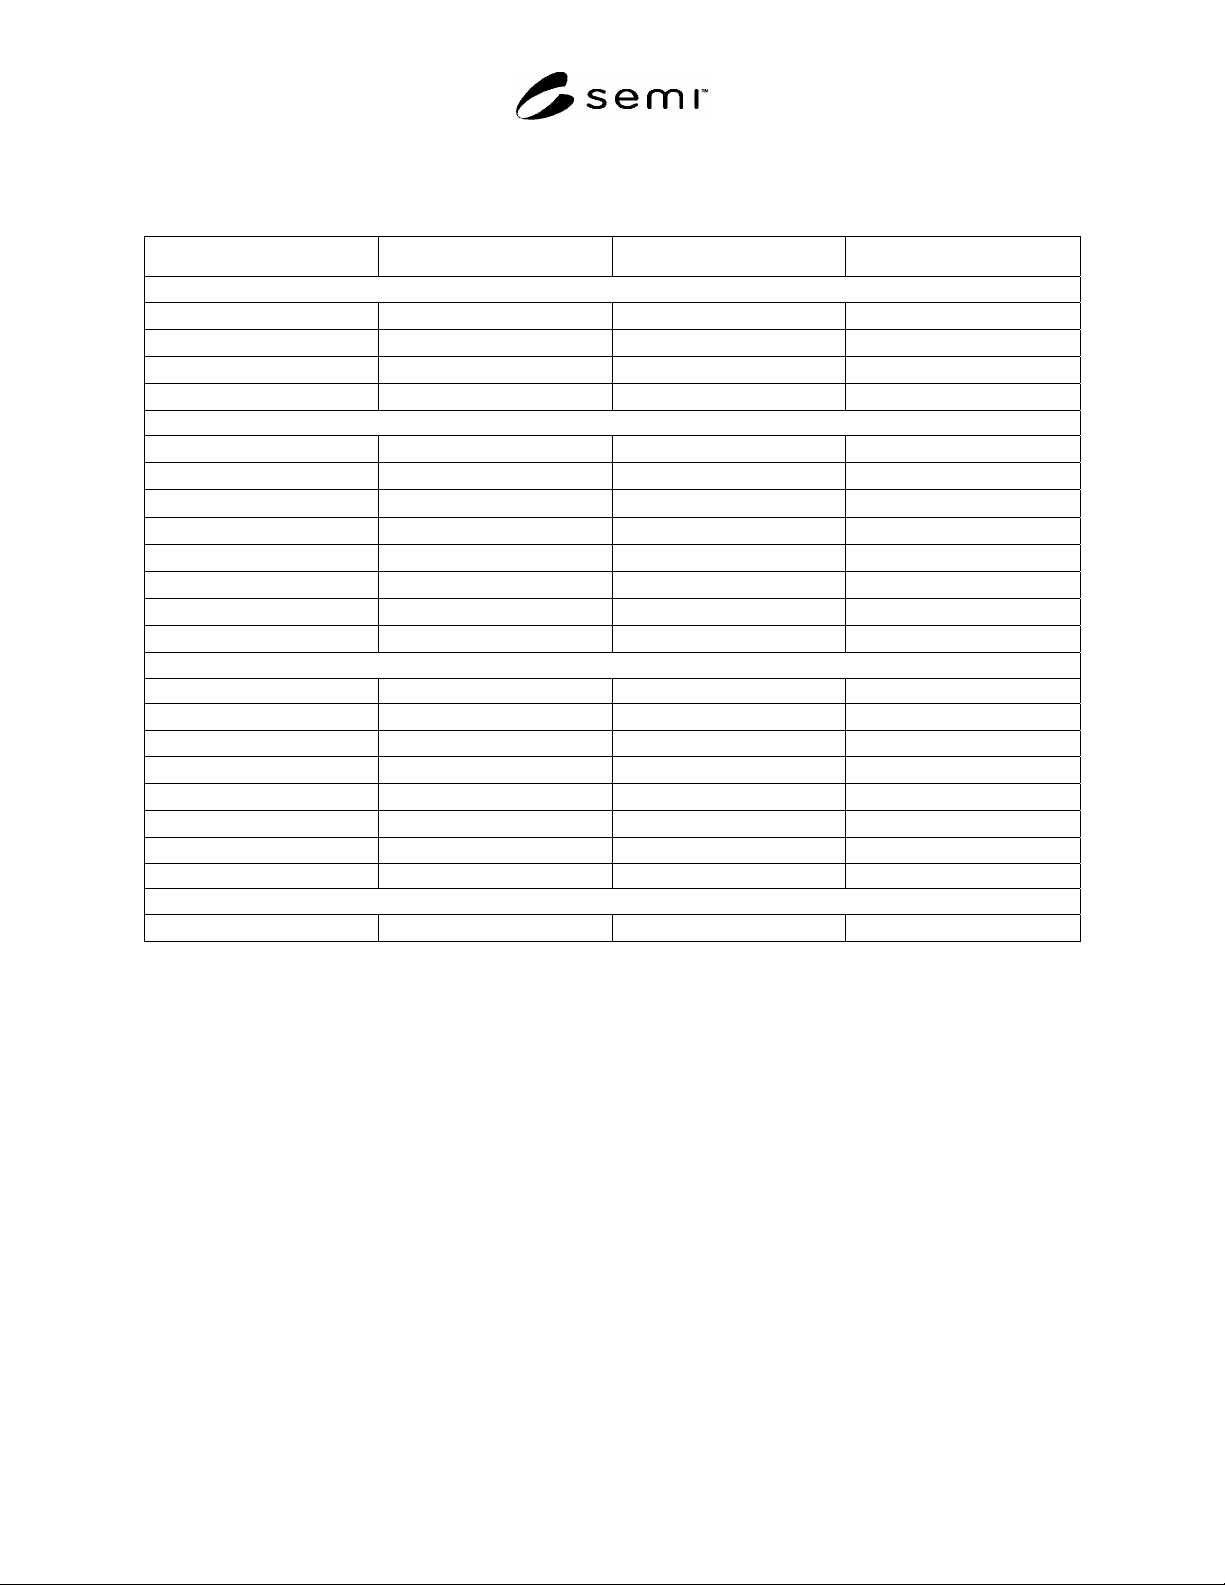
Table R1-2 Description of Probe and Specimen Preparation Conditions Used in Each Laboratory
Laboratory Number Probe Material Probe Load, g Specimen Preparation
Diamond Planar-Polished
3 Tungsten-Osmium 10
0.5 m diamond
3 Tungsten-Osmium 20
0.5 m diamond
5 Tungsten-Osmium 45
0.5 m diamond
14 Tungsten-Osmium 45
1 m diamond
Diamond Bevel-Polished
1 Tungsten-Osmium 20
0.1 m diamond
3 Tungsten-Osmium 10
0.1 m diamond
3 Tungsten-Osmium 20
0.1 m diamond
4 Tungsten-Ruthenium 5
0.25 m diamond
6 Tungsten-Osmium 10
0.5 m diamond
9 Tungsten-Osmium 22
0.1 m diamond
9 Tungsten-Osmium 5
0.1 m diamond
12 Tungsten-Osmium 20
0.1 m diamond
Silica Bevel-Polished
3 Tungsten-Osmium 10 …
3 Tungsten-Osmium 10
Bake at 150C
3 Tungsten-Osmium 20 …
3 Tungsten-Osmium 20
Bake at 150C
7 (Instrument 1) Tungsten-Osmium 20
Bake at 150C
7 (Instrument 2) Tungsten-Osmium 20
Bake at 150C
15 Tungsten-Osmium 45 Silica + 5% H
2
O
2
11 Tungsten-Osmium 20 (low penetration) pH = 8
Aluminum Oxide Lapped
10 Tungsten-Osmium 45
5 m Lapped Surface
R1-5 No independent checks of measurement quality were available; all inferences regarding control of the
measurement process by the participating laboratories had to be made from the test data supplied. To this end,
within each specimen preparation category, all contributed values of
r
and
R
were rank ordered. Any laboratory
which contributed significantly more than its expected fraction of the large values of either parameter was totally
dropped from further analysis. (The only exception was Laboratory 3 in the diamond-planar-polished category.
Although its data were generally higher than those from the other two laboratories, they were generally of
reasonable absolute value and were likely due to the noticeably lower probe loads used by Laboratory 3.) As a result
of this screening, data from the following laboratories were omitted from further analysis: diamond bevel
polishing—Laboratory 6 and Laboratory 9 at 5 g, silica bevel polishing—Laboratory 11.
R1-5.1 Plots of average values of
r
and
R
as a function of resistivity only are shown in Figure R1-1. These plots
were obtained by simple averaging of all values of these parameters, as a function of specimen resistivity, for all
laboratories whose data were not rejected. From these plots it is seen that single fixed values of
r
, or
R
, do not
apply to the entire range of specimen resistivities measured. Each category of diamond polish appears to have a
reasonably constant value of
r
or
R
, for the specimen range from 0.05 to 200 ·cm. Silica-beveled specimens
have a reasonably constant value of in this resistivity range; however, it is difficult to establish a single value of
R
over any reasonable resistivity range for silica-polished specimens.
R1-5.2 Re-examination of laboratory data for the two highest resistivity specimens indicated a strong possibility of
resistivity variations in these two specimens as well as a variety of reported probe control problems that were not
SEMI MF525-0705 © SEMI 2003, 2005 13
found with the lower resistivity specimens. It was therefore decided to omit the two highest resistivity specimens
from further analysis.
R1-6 Tests of the distribution of reported values of
r
and
R
within each category indicated that they had too much
variability to be consistent with single underlying values of repeatability and reproducibility in any of the
preparation categories. It is probable that some of this excess variability resulted from the variety of probe
conditions and specimen orientations, conductivity types, and surface preparation details. Nevertheless, the effect of
this excess variability was that overall estimates of
r
and
R
could not be obtained from root-mean-square pooling
of the respective variances. These overall estimates were obtained instead as percentiles of the distributions of the
contributed values in each category from specimens in the resistivity range from 0.01 to 200 ·cm.
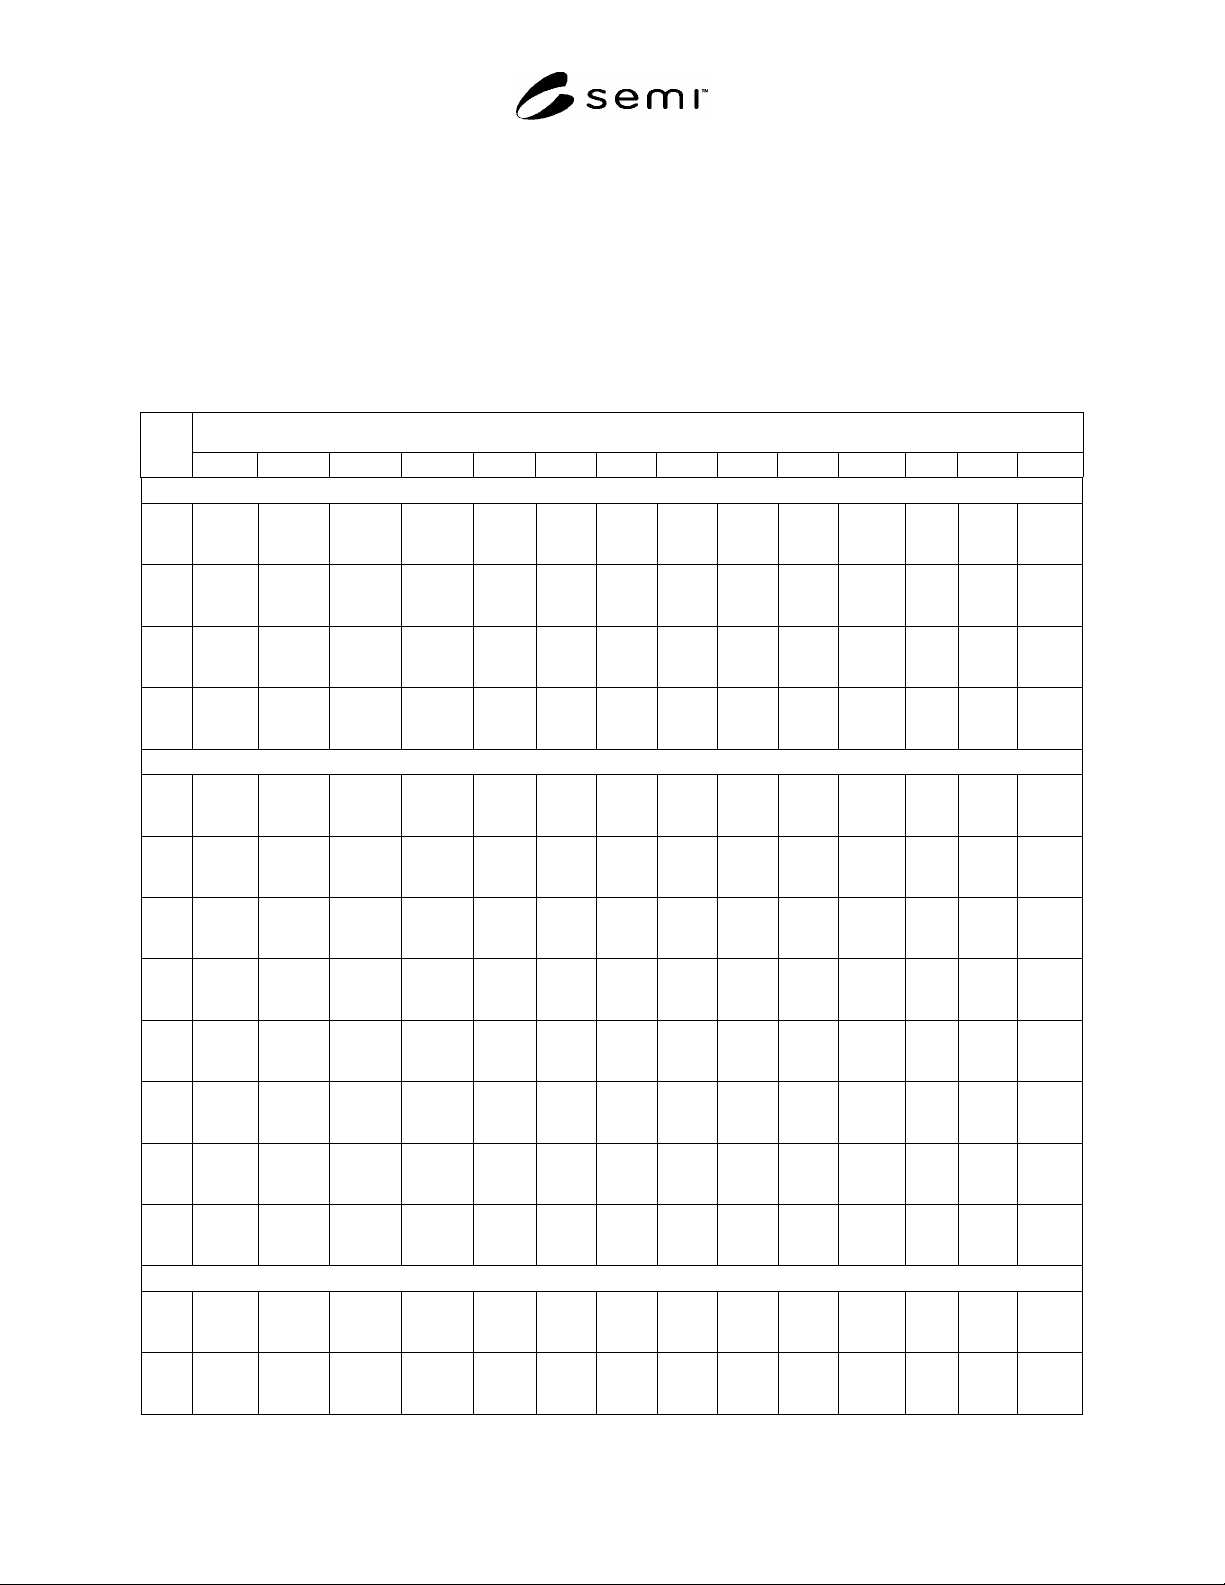
Table R1-3 Summary of Round Robin Data
Specimen Identification
Lab
#
C D E F G H J K L M N P R T
Diamond-Planar Polish
#1
3
10 g
4.16 k
5.1%
2.2%
18.1 k
3.5%
2.5%
2.09 M
26.0%
9.7%
9.19 M
6.6%
2.9%
1.01 k
4.5%
2.6%
42.1 k
2.2%
1.4%
19.2 k
4.1%
1.4%
74.6
6.8%
3.1%
12.0
7.5%
4.5%
55.6 k
6.3%
2.8%
1.98 M
6.8%
3.0%
36.1
0.9%
2.2%
1.17 k
5.0%
2.5%
745 k
3.4%
2.5%
3
20 g
2.05 k
2.2%
1.7%
10.6 k
2.2%
1.4%
5.79 M
25.0%
12.0%
4.37 M
4.6%
2.9%
587
2.8%
1.7%
25.2 k
2.5%
1.8%
11.3 k
2.6%
1.6%
49.0
7.1%
2.1%
6.75
6.6%
1.5%
28.9 k
2.4%
2.0%
860. k
4.7%
2.1%
24.1
4.9%
2.2%
779.
6.0%
2.2%
358 k
1.4%
2.0%
5
B
886.
1.2%
…
6.05 k
0.9%
…
4.36 M
20.0%
…
1.59 M
6.5%
…
316
2.0%
…
15.4 k
2.2%
…
7.14 k
0.4%
…
24.0
1.7%
…
3.88
0.8%
…
12.7 k
4.5%
…
470. k
0.0%
…
12.2
0.7
…
411.
2.1%
…
219 k
2.9%
…
14
1.69 k
0.4%
1.6%
9.22 k
0.3%
1.6%
1.09 M
1.6%
1.2%
4.16 M
5.1%
10.9%
728
0.8%
3.8%
15.8 k
0.3%
1.0%
9.51 k
0.3%
1.3%
35.1
0.5%
0.9%
5.34
0.5%
2.3%
21.3 k
0.8%
1.8%
487. k
0.2%
1.1%
17.6
1.3%
1.1%
1.01 k
1.1%
4.6%
215 k
2.4%
8.5%
Diamond-Bevel Polish
#1
1
2.20 k
5.6%
4.6%
10.4 k
1.4%
3.4%
6.15 M
1.8%
28.0%
6.15 M
11.8%
14.4%
744.
2.3%
3.6%
24.5 k
1.2%
2.0%
11.1 k
1.9%
2.0%
54.8
8.1%
4.0%
9.51
20.0%
6.0%
27.2 k
6.8%
5.6%
888 k
0.9%
6.1%
26.2
0.6%
1.9%
726
2.5%
4.0%
370 k
2.5%
5.8%
3
10 g
3.36 k
1.6%
3.0%
17.9 k
2.1%
2.7%
7.21 M
3.5%
3.5%
15.8 M
5.3%
4.2%
1.22 k
1.5%
3.6%
45.2 k
4.2%
1.7%
21.3 k
1.4%
3.6%
72.4
3.6%
3.8%
9.89
4.4%
4.6%
58.2 k
3.6%
3.6%
2.46 M
4.0%
4.0%
42.2
6.2%
3.0%
1.36 k
3.0%
2.6%
1.01 M
2.3%
3.5%
3
20 g
2.33 k
2.5%
2.5%
10.5 k
1.3%
1.8%
2.48 M
6.90%
3.9%
7.10 M
5.5%
3.7%
698.
3.6%
3.2%
24.0 k
1.5%
1.7%
11.8 k
2.4%
2.4%
49.4
4.6%
3.3%
6.35
4.9%
1.7%
11.3 k
2.4%
2.4%
1.04 M
5.8%
2.9%
25.0
3.0%
2.3%
824
1.8%
2.3%
424 k
2.3%
2.2%
4
5.43 k
1.8%
2.9%
22.5 k
2.4%
2.6%
20.5 M
3.8%
4.6%
13.6 M
18.0%
9.8%
1.54 k
1.7%
3.1%
67.3 k
1.8%
2.4%
27.6 k
1.8%
2.4%
105
1.4%
1.9%
14.2
4.5%
1.8%
70.0 k
4.4%
4.2%
3.03 M
8.4%
8.0%
…
…
…
…
…
…
1.06 M
1.6%
3.4%
6
4.09 k
2.2%
5.9%
17.9 k
3.1%
4.5%
3.24 M
2.60%
8.0%
10.2 M
17.9%
12.6%
1.52 k
16.2%
10.0%
39.1 k
0.7%
3.4%
15.7 k
0.8%
2.0%
108
11.0%
8.1%
20.4
12.6%
19.4%
54.4 k
7.4%
8.7%
1.48 M
22.0%
15.5%
58.6
6.9%
10.7%
1.40 k
2.0%
8.8%
647 k
2.5%
13.1%
9
22 g
2.30 k
4.2%
4.0%
13.2 k
4.4%
7.6%
33.9 M
10.7%
46.0%
3.79 M
7.7%
9.9%
877
5.3%
6.3%
28.3 k
2.4%
1.3%
15.1 k
2.3%
5.4%
44.6
2.8%
2.1%
6.48
2.7%
3.2%
30.9 k
2.9%
3.8%
1.16 M
5.2%
3.4%
27.5
2.2%
2.3%
1.05 k
3.5%
5.0%
525 k
1.8%
4.6%
9
5 g
7.84 k
5.6%
9.7%
62.6 k
9.0%
18.4%
12.6 M
11.0%
10.2%
16.0 M
6.2%
5.1%
3.96 k
1.7%
18.7%
60.3 k
1.4%
1.5%
35.8 k
3.7%
5.3%
122
21.0%
5.3%
15.9
9.0%
8.0%
92.8 k
9.7%
5.2%
6.89 M
16.0%
8.7%
86.5
5.6%
8.1%
3.36 k
9.9%
20.0%
1.67 M
15.0%
6.2%
12
4.91 k
1.8%
5.2%
14.8 k
3.9%
8.0%
40.7 M
6.5%
35.0%
28.8 M
5.1%
13.3%
830
4.9%
3.3%
31.1 k
1.5%
3.6%
14.9 k
2.8%
5.6%
47.9
5.4%
3.5%
8.45
5.1%
4.4%
41.3 k
0.6%
8.7%
3.39 M
6.5%
9.9%
49.2
3.2%
5.1%
1.69 k
8.5%
7.3%
1.48 M
11.9%
6.8%
Silica-Bevel Polish
#1
3
10 g
3.82 k
14.0%
2.6%
65.8 k
30.0%
4.7%
888 k
80.0%
6.4%
616 k
3.0%
12.3%
1.88 k
11.3%
3.7%
38.2 k
17.8%
2.3%
87.8 k
17.8%
2.3%
73.8
6.3%
2.0%
10.3
5.4%
3.3%
34.0 k
21.6%
3.1%
468 k
14.7%
6.0%
30.9
3.1%
1.7%
1.57 k
2.0%
1.7%
573 k
33.0%
6.3%
3
10 g
baked
2.95 k
12.5%
2.8%
31.1 k
8.5%
2.3%
943 k
25.0%
7.8%
723 k
23.0%
6.7%
1.45 k
4.1%
3.6%
30.9 k
14.6%
2.7%
35.4 k
7.0%
2.2%
79.2
3.8%
1.9%
10.7
0.7%
3.2%
31.1 k
9.2%
2.8%
610 k
49.0%
6.1%
30.7
1.5%
1.3%
1.27 k
6.6%
1.5%
365 k
29.0%
6.4%