semi合集-English.pdf - 第5844页
SEMI P32-1104 © SEMI 1998, 2004 4 8.2 Blank Test 8.2.1 Pre pare a blan k test solut ion. 8.2.2 Measure each bl ank test s olution. 8.2.3 The observed data should be adjust ed for background corre ction, if necessary. 8.2…
SEMI P32-1104 © SEMI 1998, 2004 3
7.3 Environment
7.3.1 The measurement is recommended to be
performed in a clean room or clean zone at constant
temperature. The stability of temperature should be
better than ± 2°C. Dry ashing method should be
performed in a draft chamber with HEPA filter, if
possible.
7.3.2 In the case of volumetric analysis, the
measurement environment is set to the standard
temperature of measuring tools such as volumetric flask
and measuring pipette.
8 Procedures
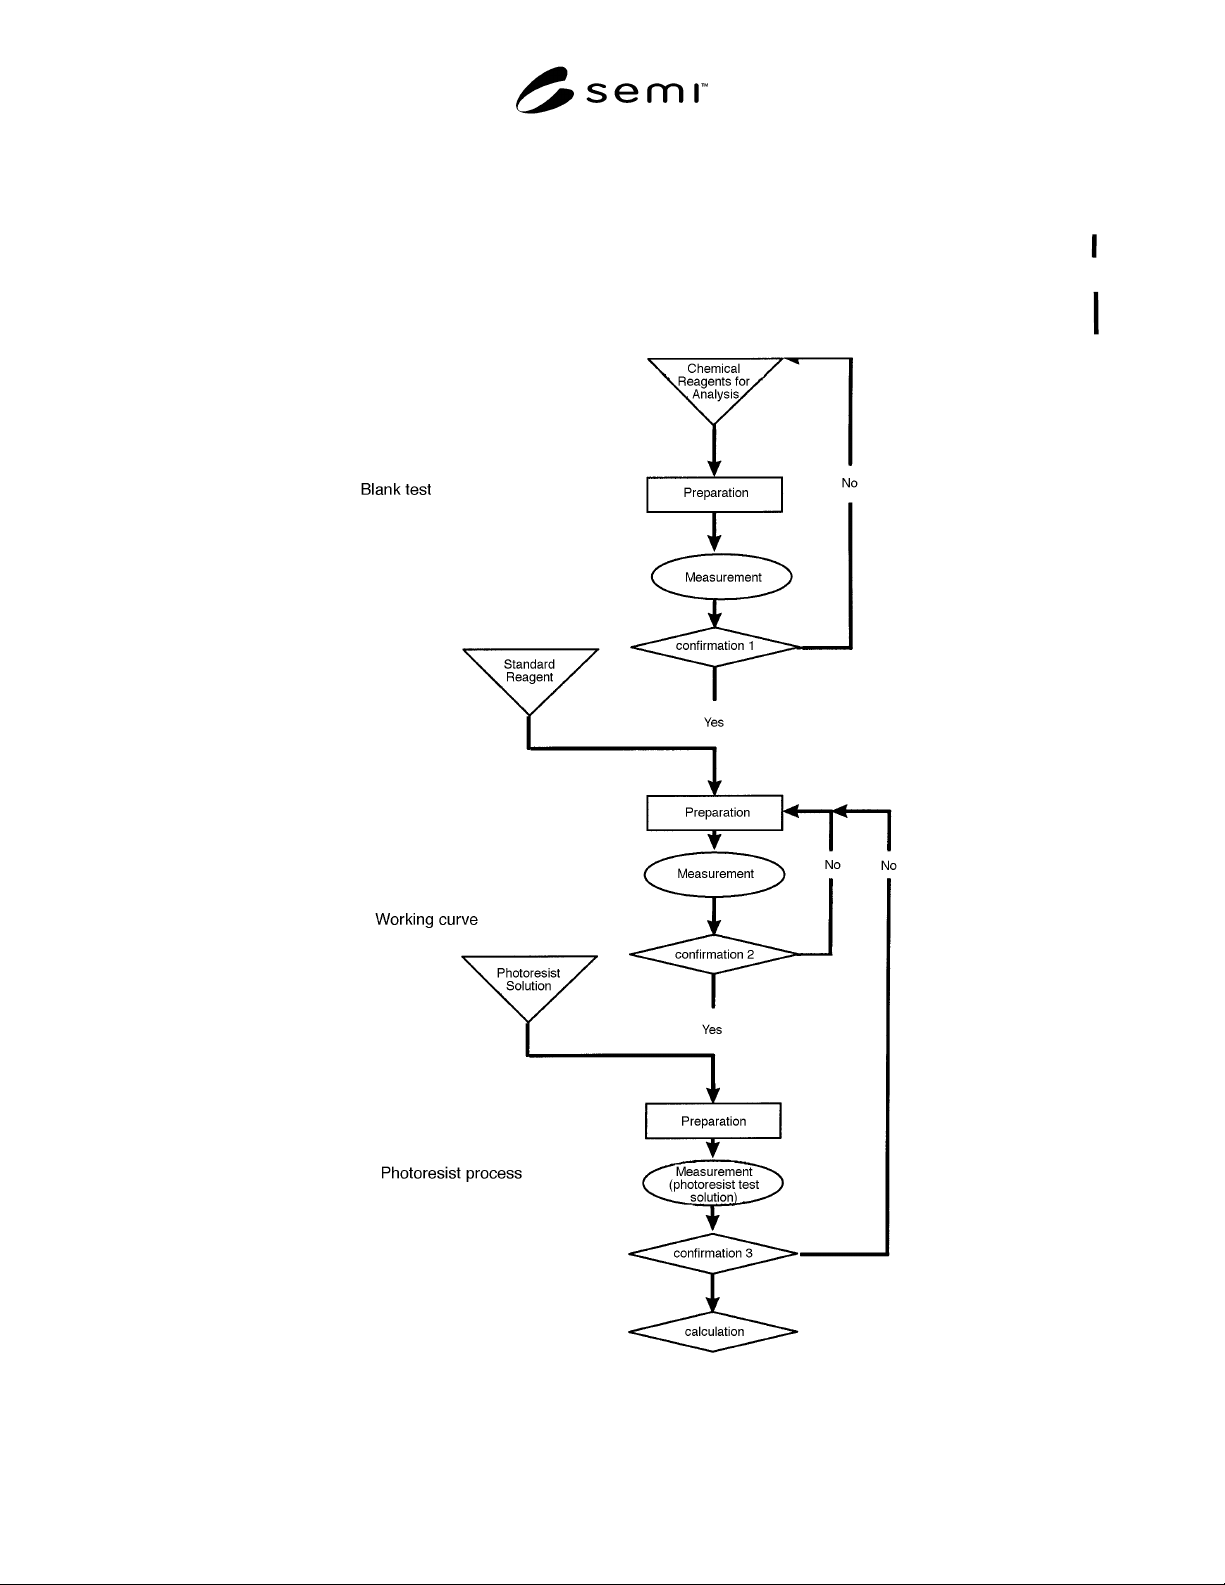
8.1 Flow Chart of Measurement — Refer to Figure 1
as suggested analysis process.
Figure 1
Flow Chart of Trace Metal Measurement

SEMI P32-1104 © SEMI 1998, 2004 4
8.2 Blank Test
8.2.1 Prepare a blank test solution.
8.2.2 Measure each blank test solution.
8.2.3 The observed data should be adjusted for background correction, if necessary.
8.2.4 Confirmation 1 — Blank level should be equal or less than half the specification level in the photoresist.
8.3 Working Curve
8.3.1 The concentration range in the working curve should cover the anticipated concentration in photoresist test
solution.
8.3.2 Prepare a standard solution with a known metal concentration using the reagents that are used in preparing the
photoresist test solution.
8.3.3 Measure each metal element in the standard solution.
8.3.4 The observed data should be adjusted for the blank level and background correction.
8.3.5 Prepare a working curve for each metal element.
8.3.6 Confirmation 2 — Working curve should be linear in the concentration range of standard solution.
8.4 Measurement of Photoresist Test Solution
8.4.1 Dry Ashing Method
8.4.1.1 Remove the solvent of photoresist by evaporation using Platinum crucible.
8.4.1.2 Ash the matrix by heating using Platinum crucible. Ashing temperature should be referred to Table 3. Resist
cannot be ashed without possible loss of some elements, so loss of each element should be investigated before trace
metal analysis.
Table 3 Recommended Ashing Temperature
Element Ashing Temperature (°C) Flame Component
Al 1000 N
2
O-C
2
H
2
Ca 800 Air-C
2
H
2
N
2
O-C
2
H
2
Cr 800 Air-C
2
H
2
N
2
O-C
2
H
2
Cu 800 Air-C
2
H
2
F3 (NOTE 4) 600
300 (if FeCl
3
presents)
Air-C
2
H
2
N
2
O-C
2
H
2
Mg 600 Air-C
2
H
2
N
2
O-C
2
H
2
Mn 800 Air-C
2
H
2
N
2
O-C
2
H
2
Ni 800 Air-C
2
H
2
K (NOTE 5) < 500 Air-C
2
H
2
H
2
-O
2
Na (NOTE 5) < 500 Air-C
2
H
2
H
2
-O
2
NOTE 4: Iron can be present as ferric chloride and ferric chloride boils at 310°C.
NOTE 5: These elements tend to volatilize over 500°C.
8.4.1.3 Dissolve the ash in platinum crucible with acid.
8.4.1.4 Prepare a photoresist test solution in a volumetric flask with a constant volume of solvent.
8.4.1.5 In F-AAS analysis, analytical wavelength should be determined referring to Table 1. In ICP-MS analysis,
analytical mass number should be determined referring to Table 1.
8.4.1.6 Measure each metal element in the photoresist test solution.
8.4.1.7 The observed data should be adjusted for blank level and background corrections.

SEMI P32-1104 © SEMI 1998, 2004 5
8.4.2 Direct Method
8.4.2.1 Prepare a photoresist test solution by diluting. Solvents such as PGMEA or EL are recommended.
8.4.2.2 Record the name of diluting solvent and dilution factor. Dilution factor is recommended to be in the range of
5 to 50.
8.4.2.3 In GF-AAS or ETA-AAS analysis, furnace program (step, temperature, ramp time, hold time) should be
determined referring to Table 4 before trace metal analysis.
Table 4 Recommended Furnace Program for GF-AAS and ETA-AAS
Element Drying Temperature (°C) Ashing Temperature (°C) Atomization Temperature (°C)
Al 130 1400 2700
Ca 130 1300 2600
Cr 130 1300 2700
Cu 130 900 1600
Fe 130 900 2500
Mg 130 900 2200
Mn 130 900 2600
Ni 130 1200 2700
K 130 800 2000
Na 130 800 2000
8.4.2.4 In GF-AAS, ETA-AAS, or ICP-AES analysis, analytical wavelength should be determined referring to
Table 1. In ICP-MS or MIP-MS analysis, analytical mass number should be determined referring to Table 1.
8.4.2.5 Measure each metal element in the photoresist test solution.
8.4.2.6 The observed data should be adjusted for the blank level and background correction.
8.5 Concentration of Trace Metal in Photoresist
8.5.1 The concentration of trace metal in a photoresist test solution is determined from the working curve.
8.5.2 Confirmation 3 — The observed concentration of photoresist test solution should be in the concentration
range of working curve.
9 Suggested Reporting Information
9.1 Company
9.2 Test date
9.3 Photoresist
9.3.1 Commercial name
9.3.2 Tone
9.3.3 Lot No.
9.4 Results
9.4.1 Element
9.4.2 Concentration (ppb)
9.4.3 Method of chemical analysis
9.4.4 Other information on chemical analysis should be added to the reporting results by mutual agreement between
users and suppliers.