semi合集-English.pdf - 第3931页
SEMI F35-0304 © SEMI 1998, 2004 5 16 Atmospheric Leak Locating Procedur e 16.1 Familiarize yourself with Figure 1 before proceeding with the remainder of Section 16. Figure 1 Typical Fab UHP Gas Distri bution System 16.2…

SEMI F35-0304 © SEMI 1998, 2004 4
13.3 There will be two modes of O
2
measurement:
13.3.1 Critical Sample Point O
2
Measurement
13.3.1.1 Applicable to O
2
measurements performed
continuously on the critical sample point locations
identified earlier.
13.3.1.2 Prior to continuous data collection use of the
analyzer, validate it by demonstrating the capability
required in the specification for Weekly Zero Drift.
Chart the zero baseline drift and peak-to-peak noise
while on zero gas for 1 week.
13.3.1.3 Re-validate the O
2
analyzer performance by
running a 24-hour blank test on zero gas monthly.
13.3.2 Investigative Sample Point O
2
Measurement
13.3.2.1 Applicable to spot check O
2
measurements
performed in the investigation of locating atmospheric
leak sources.
13.3.2.2 The O
2
analyzer must be operated for a time
period sufficient to establish the “contaminant
signature” at the point of interest.
13.3.2.3 Validate the O
2
analyzer with a blank test
prior to each use. Chart zero baseline drift over a period
of time which is twice as long as the expected time
required to make the O
2
measurement. If a
measurement can typically be made successfully in less
than one hour, then verify the zero drift and peak-
topeak noise with a two-hour blank test.
14 Data Collection Procedure
14.1 Collect all O
2
measurement data at a minimum of
1 point/minute using a chart recorder or data acquisition
device.
14.2 Graph data points with sufficient resolution to
observe trends over a one-week period. The graph must
also be able to resolve O
2
spikes which may last only
10–15 minutes.
15 Interpretation of Results
15.1 Generate graphs of the baseline “contaminant
signature” for each critical sample point location.
Compare the baseline “contaminant signature” with the
O
2
analyzer’s blank run on zero gas to validate that the
analyzer is producing useful data. The base-line
“contaminant signature” should exhibit equal or greater
O
2
variation than the blank run on zero gas.
15.2 Problem Identification
15.2.1 Observe data from critical sample point
locations and look for deviations (abnormal trends or
events) from the baseline “contaminant signature”.
15.2.2 Determine if deviations (observed trends or
events) are sufficient to impede mandatory atmospheric
impurity specifications or influence critical
product/process quality.
15.2.2.1 If yes, proceed into Section 16.
15.2.2.2 If no, continue observing O
2
data from critical
sample point locations.
SEMI F35-0304 © SEMI 1998, 2004 5
16 Atmospheric Leak Locating Procedure
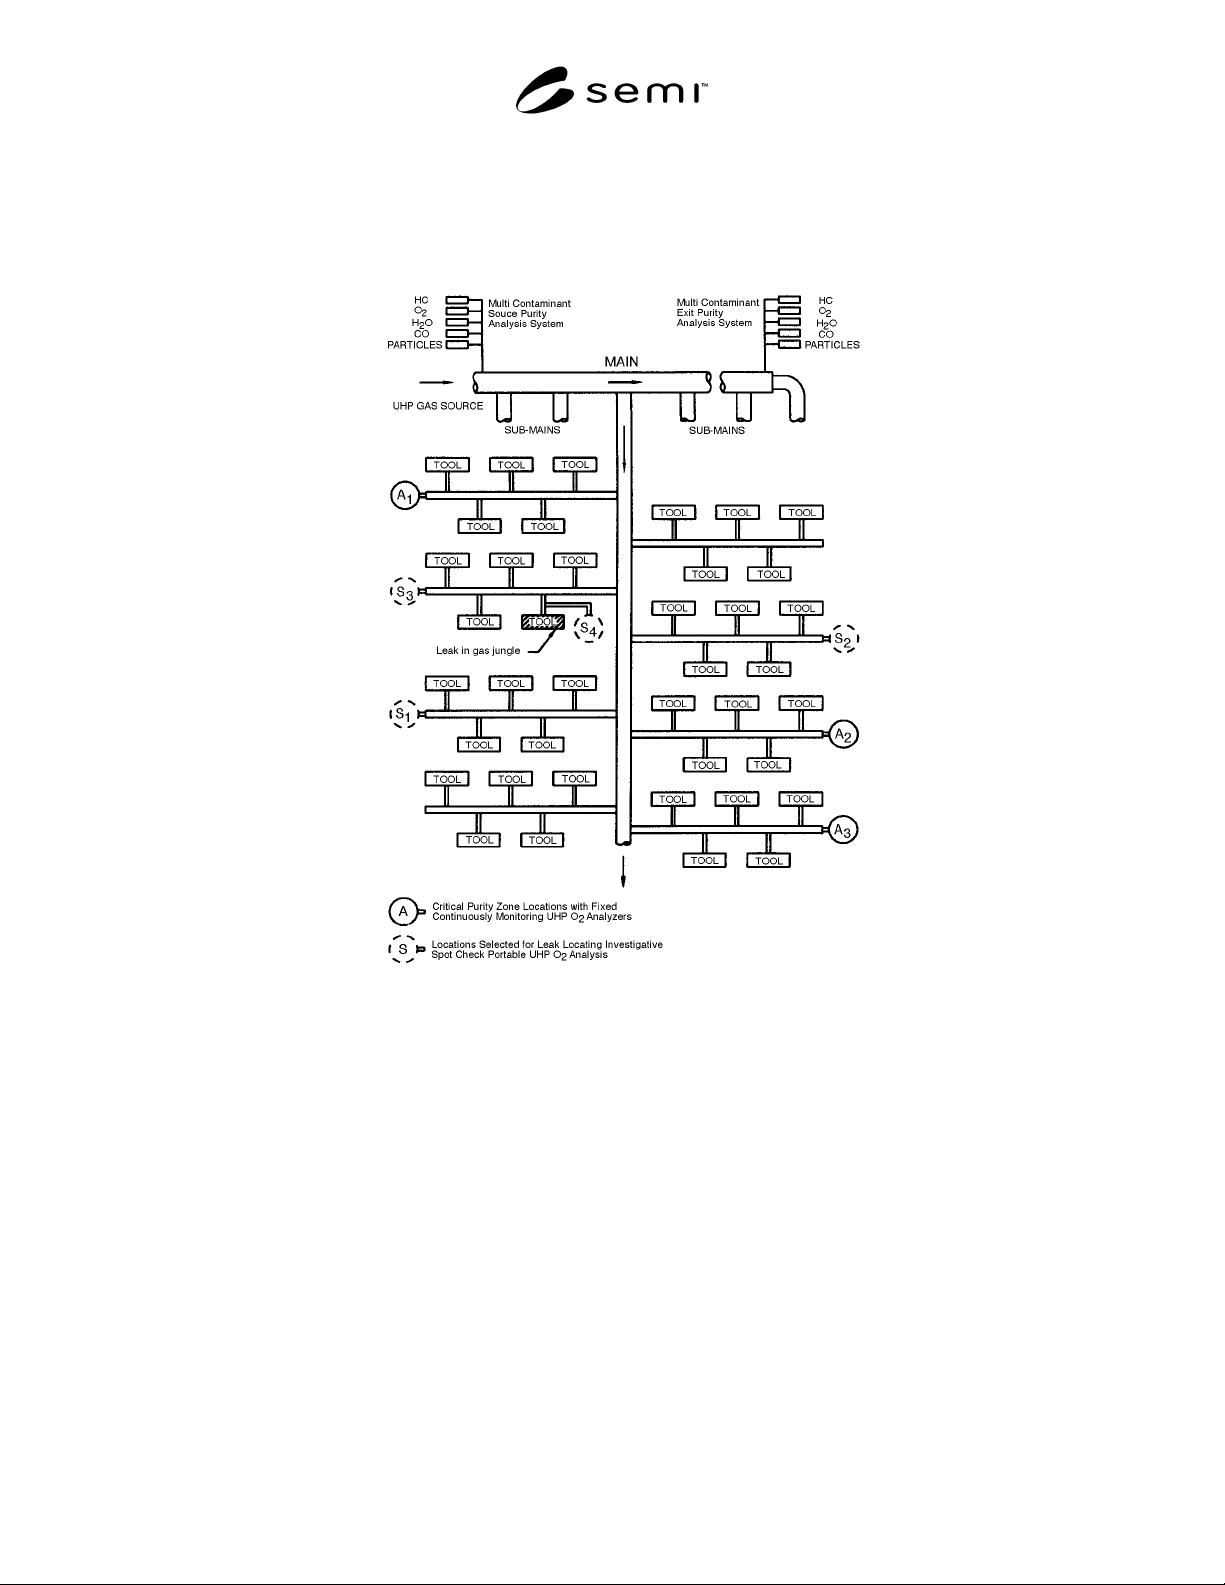
16.1 Familiarize yourself with Figure 1 before proceeding with the remainder of Section 16.
Figure 1
Typical Fab UHP Gas Distribution System
16.2 Isolate a zone where the contamination is likely to originate from by comparing the O
2
levels at the critical
continuous monitoring sample point locations. Assume the leak source is somewhere between the last
uncontaminated sample point and the first contaminated sample point going downstream. Some knowledge of the
gas distribution flow path will be required here.
16.3 Compare the data from the O
2
analyzer detecting the contamination with pressure and flow data, or gas usage
demand over time in the specific lateral of the gas distribution system where the O
2
analysis is being made.
16.4 Correlate the changes in O
2
readings which show abnormally high O
2
levels with specific tool cycles that
cause the UHP gas pressure and flow in the lateral line to change. The timing of the analyzer’s response to these
usage demands will give some clues as to the approximate position of the atmospheric leak source.
NOTE 3: Back-contamination is likely originating in a leg which is dead at the time the O
2
analyzer responds. Actual response
time will depend on the time needed for the contaminant to travel to the O
2
analyzer plus the response time of the O
2
analyzer.
16.5 If no demand cycles in the lateral cause O
2
readings to change, then the source of contamination is likely to
occur further upstream in the distribution system, prior to the intersection of the lateral in question. This assumes
that there is always a net flow of gas in the line leading to the intersection of the lateral being checked.
SEMI F35-0304 © SEMI 1998, 2004 6
16.6 Perform an investigative O
2
measurement (spot
check) with a portable O
2
analyzer at each lateral
location that is suspected in causing contamination in
the main or sub-main line which supplies the lateral
where the contamination was originally detected. Work
upstream away from the lateral which showed a sign of
contamination.
16.7 Once the lateral with the contamination source has
been identified, use the steps outlined in Sections 16.3
and 16.4 to locate the exact point of the atmospheric
leak source.
16.8 Refine the selection of investigative sample point
locations along with a careful study of system flow
dynamics until the leak is pinpointed and repaired.
16.9 Confirm that the leak source has been corrected
by providing an investigative O
2
measurement
downstream of the leak source.
17 Example in Locating Leak Source
17.1 See Figure 1 which is a schematic representation
of a typical fab branching type gas distribution system.
Since a loop type gas distribution system has one less
piping level between the main line and the tools, it is
more straightforward to monitor and diagnose. This
example, although more complex, has been
demonstrated in practice. It shows how an atmospheric
leak originating at a single tool location can back-
contaminate a sub-main distribution line, yet not
contaminate all the way back to the main line. In this
example, the contamination would not be detected by
the UHP analysis instrumentation typically installed on
the main line.
17.2 The “contaminant signature” oxygen analyzers are
installed at critical purity locations, shown in Figure 1
as A
1
, A
2
, and A
3
. These analyzers show baseline
“contaminant signature” O
levels of 0.2–0.5 ppb. By
definition, as established by the user for each critical
purity location, these are normal contaminant levels at
these locations.
17.2.1 A
2
and A
3
begin showing excursions up to 1–2
ppb that last for several minutes, then settle back into
the normal 0.2–0.5 ppb range. The excursions take
place infrequently at first, but then develop some
regularity. Although the absolute O
2
level detected does
not yet indicate that the potential atmospheric leak
(H
2
O and N
2
included) would pose a direct risk to the
critical purity of process tools located nearby, it does
differ significantly from the baseline “contaminant
signature”. This prompts an investigation before a full-
scale process production problem results.
17.2.2 Each of the lateral lines being monitored by A
2
and A
3
shows the same level of O
2
contamination, so it
is deduced that the contamination is coming from the
sub-main line which feeds both laterals. Since analyzer
A
1
does not show the contamination, it is further
deduced that the leak source is located between A
1
and
A
2
.
17.3 Working back upstream along the sub-main,
investigative O
2
measurements are made at each lateral
location ahead of the A
2
lateral. These investigative O
2
measurements are made using a portable O
2
analyzer
per Sections 12 and 13.
17.4 At S
1
and S
2
, similar O
2
contamination events are
observed as compared with points A
2
and A
3
. Further,
no lateral line flow changes (due to tool gas demand
cycles in those laterals) cause any change in the O
2
level.
17.5 At the third lateral, sampled as S
3
in Figure 1, the
O
2
level is significantly higher (ranging between 5–10
ppb), with periodic spikes of 50–100 ppb. At this point,
it is observed that when the usage in lateral S
3
drops to
zero (a dead leg condition), analyzers A
2
and A
3
show
O
2
readings above the “contaminant signature”. It is
therefore deduced that the S
3
lateral is the source of the
atmospheric leak.
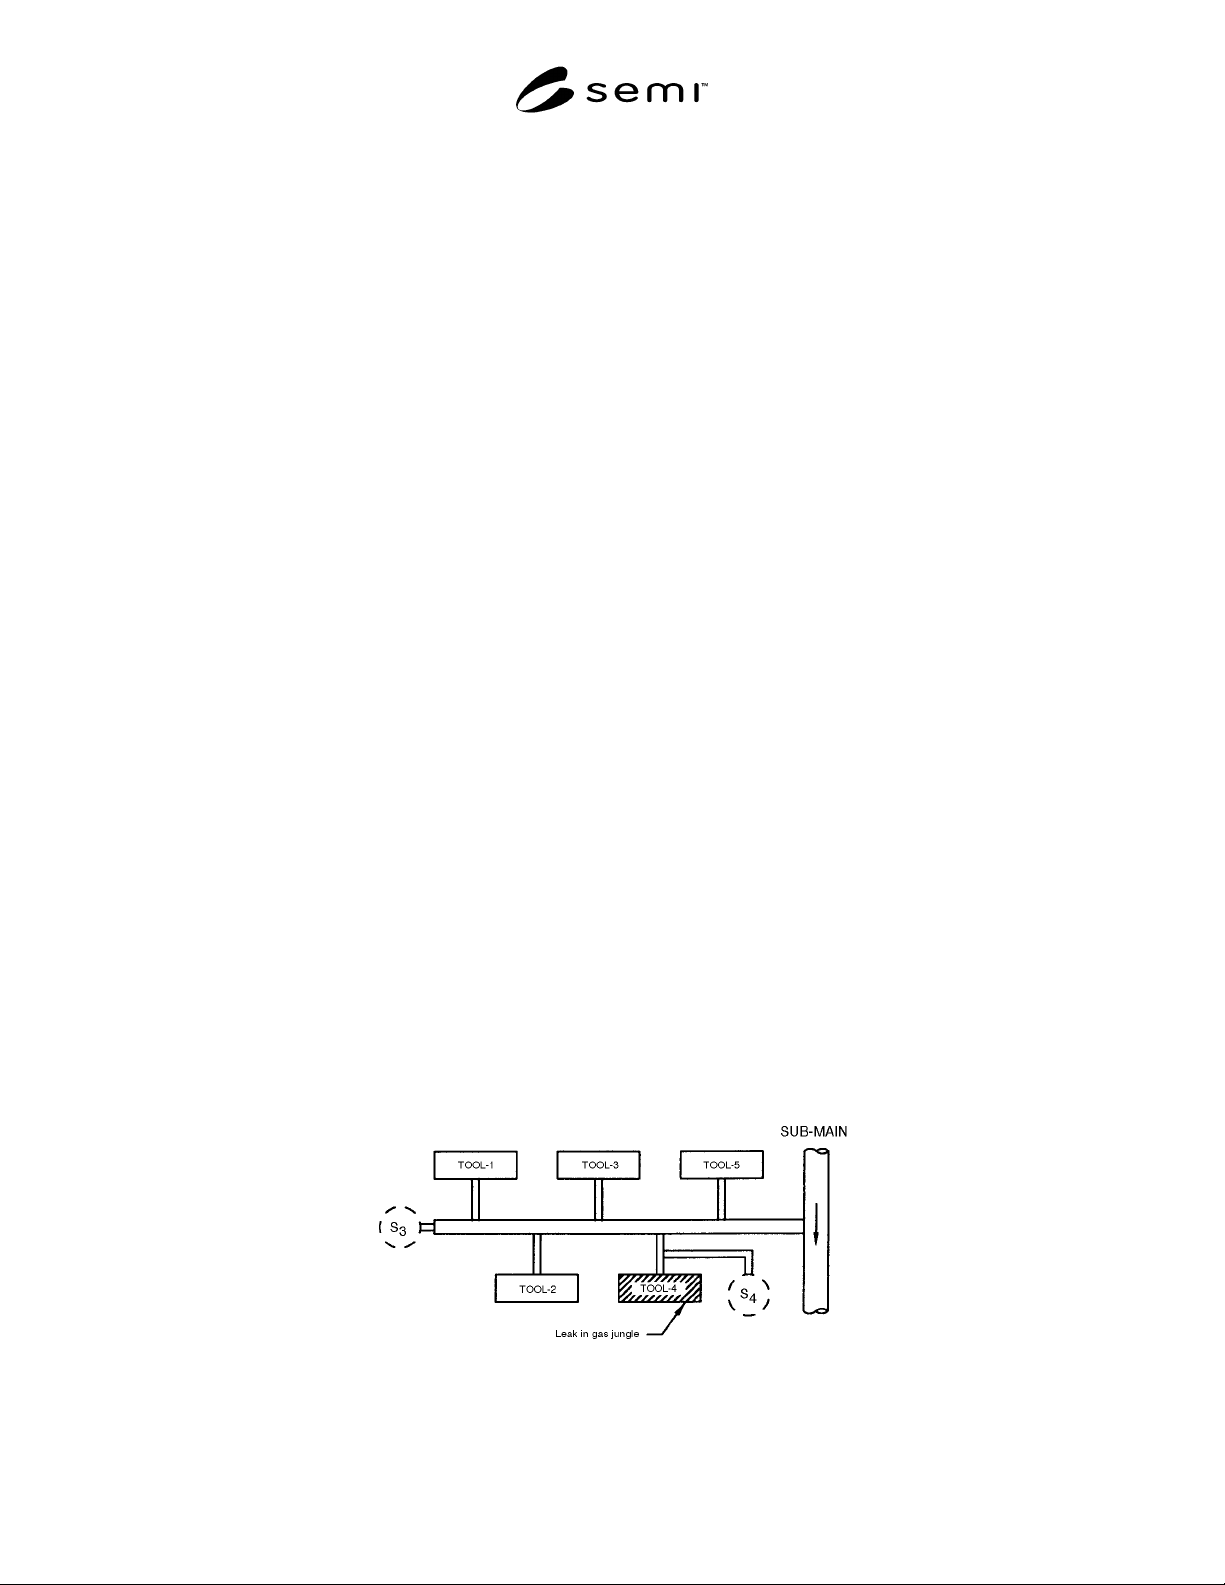
17.6 By correlating the O
2
data at S
3
with the gas usage
from the tools on this lateral, the leak source can be
further traced within this lateral. (Refer to Figure 2.)
Figure 2
Branch UHP Gas Line with Ambient Air Leak Contaminating Sub-Main Line