semi合集-English.pdf - 第4019页
SEMI F49-0200 © SEMI 2000 5 7.4 Support and Facilities Infrastr u c t ure Equipment Perform ance 7.4.1 The ef fects that support equipm e n t a nd facilities infrastru cture equi p ment have on proces s equipm e nt shoul…

SEMI F49-0200 © SEMI 2000 4
6.2.3 Facilities Infrastructure Equipment
• Exhaust systems (scrubbers and VOC exhaust fans
and controls)
• Process cooling water system (pumps and controls)
• Air compressors (and controls)
• Vacuum system (pumps and controls)
• Bulk and specialty gas distribution systems (pumps
and controls)
• Liquid chemical distribution systems (pumps and
controls)
• Power distribution systems
7 Power Monitoring and Co nditioning
Recommendations
7.1 Reasons for Monitoring and Conditioning
7.1.1 Semiconductor manufacturing facility electrical
distribution systems should be designed to transport
power to process equipment, support equipment, and
other facilities infrastructure equipment without
degradation to the electrical power quality. The system
should recognize electrical power that does not meet
specification and provide proper power conditioning so
as not to impact wafer processing.
7.1.2 Power monitoring is used to measure electrical
system power quality performance for the following
reasons.
a) Monitoring data can be compared to
equipment voltage sag specifications to
identify problems.
b) Selection and control of power conditioning
devices are dependent upon monitoring
measurements.
7.1.3 Power conditioning is implemented to correct for
gaps in equipment voltage sag susceptibility and point
of connection electrical power performance. Power
conditioning is occasionally implemented where the
risk of unacceptable equipment performance is high,
where equipment performance tolerance is outside
specifications, and where equipment interruption is
costly.
7.2 Monitoring and Conditioning Program
7.2.1 Quantify the process equipment, support
equipment, and facilities infrastructure equipment
voltage sag susceptibility using industry standard
specifications and test methods. (See Sections 7.3 and
7.4.)
7.2.2 Set-up monitors for utility power quality (see
Section 7.5).
7.2.3 Measure and/or model the impact of the facility
electrical distribution system on the utility power
delivered to the process equipment (see Section 7.6).
7.2.4 Model and evaluate cost/benefit of power
conditioning solutions where there are gaps or high
risks. Select and implement identified power
conditioning solutions into the facilities electrical
distribution system. (See Section 7.7.)
7.2.5 Maintain the installed power conditioning
equipment and monitor the power either continuously
or periodically to assure performance and evaluate
results.
7.3 Process Equipment Performance
7.3.1 Facility design specifications should include
requirements for processing equipment voltage sag
immunity (see industry specification for semiconductor
processing equipment voltage sag immunity). (See
Related Documents section.)
7.3.2 Variability in process equipment manufacturing
and supplied utility power quality preclude interruption
free manufacturing. This variation comes from
multiple sources:
a) Verification of representative samples of
equipment does not guarantee 100% of the
equipment will meet the same requirements.
b) Factors such as location, load changes,
capacity, weather, and transmission/
distribution equipment, limit how well utility
power quality can be controlled.
c) The tests, themselves, are not variation free;
the test equipment, calibration processes, and
the test personnel can introduce further
variability.
7.3.3 The risk of manufacturing interruptions can be
considerably reduced through two approaches.
a) Create a margin between allowable voltage sag
for the supplied utility power and process
equipment voltage sag immunity.
b) Provide added protection from interruptions
due to voltage sag events by enhancing the
power quality in the facilities distribution
system. (This approach is covered in this
document, see Scope and the middle segment
of Figure 1.)

SEMI F49-0200 © SEMI 20005
7.4 Support and Facilities Infrastructure Equipment
Performance
7.4.1 The effects that support equipment and facilities
infrastructure equipment have on process equipment
should be considered.
7.4.2 Process and support equipment typically contain
flow, temperature, or pressure sensors. If facility
infrastructure equipment malfunctions due to a voltage
sag event, the diminished flow of a required fluid or gas
will cause the support or process equipment to alarm,
malfunction, or stop.
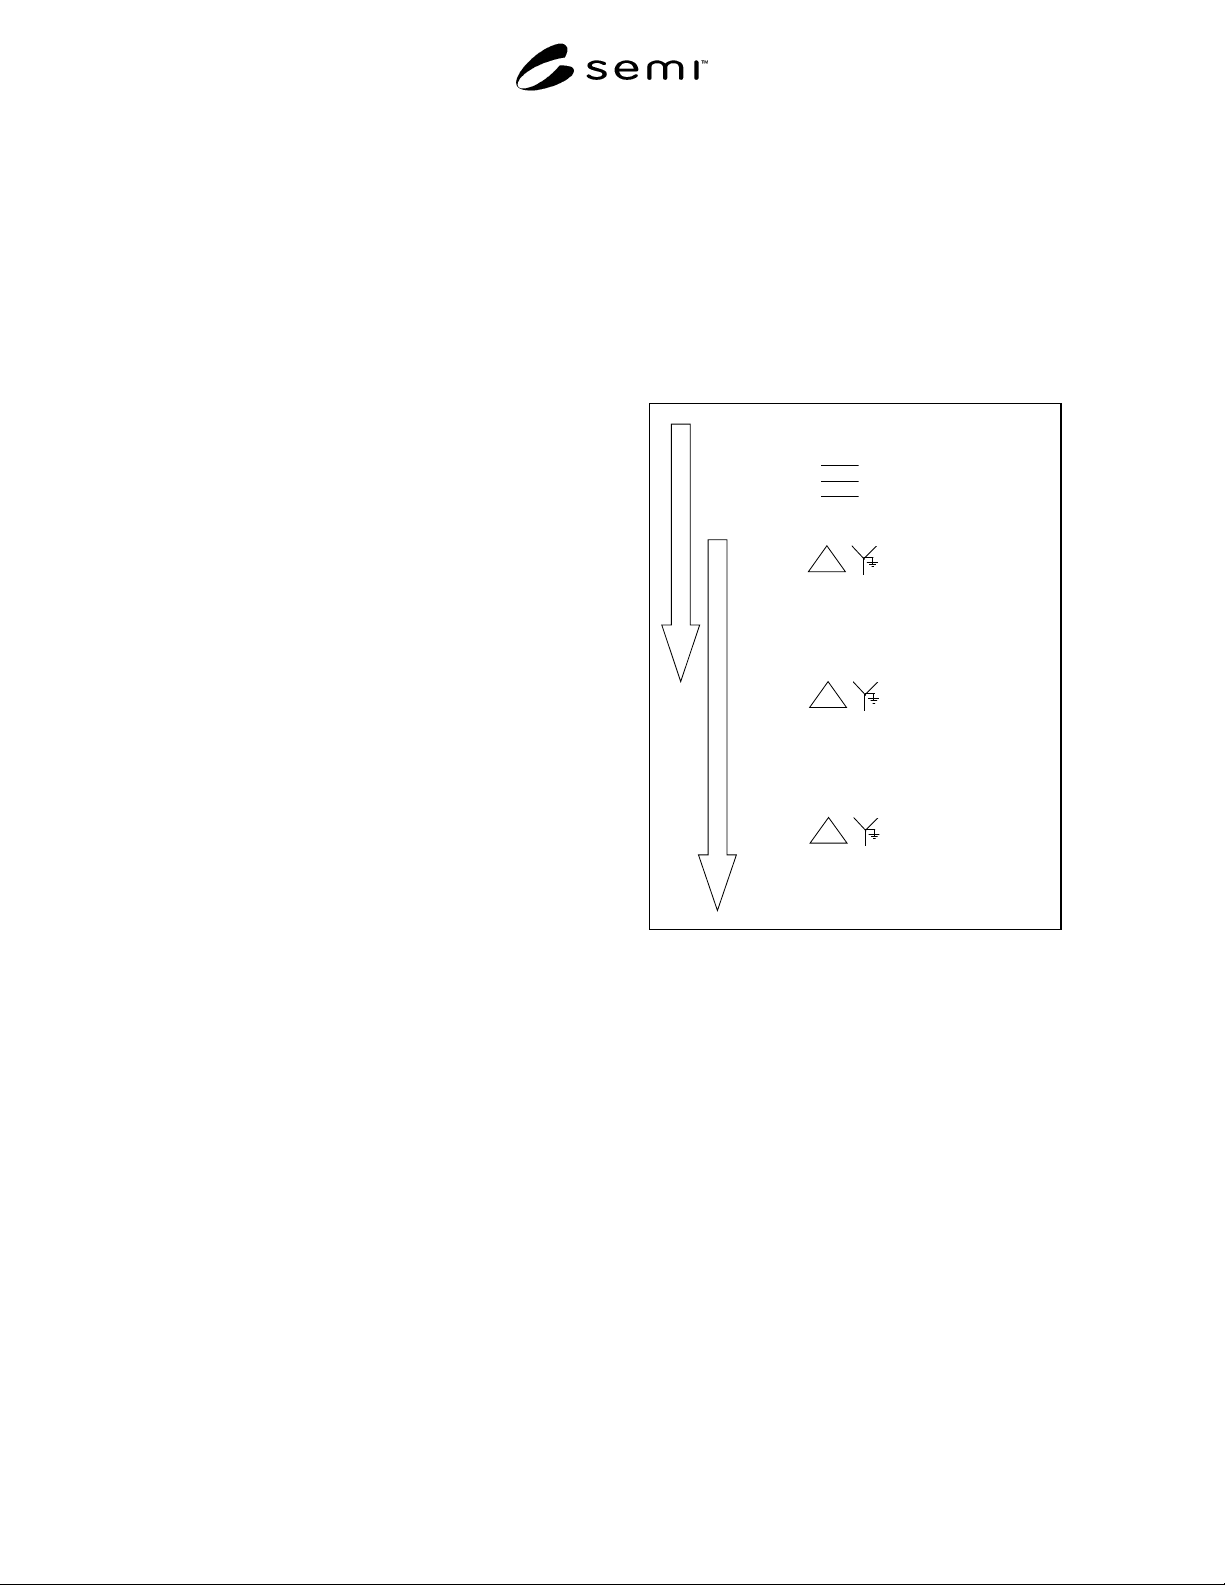
7.4.3 A typical interconnection of facility
infrastructure equipment with process and support
equipment is illustrated in Figure 2. The various
support and facilities infrastructure systems that can
have an indirect effect on process equipment
performance when subjected to voltage sag events are
listed below:
• Process cooling water,
• Scrubbed exhaust,
• Volatile organic compound (VOC) exhaust,
• Gas cabinets and gas monitoring system
controllers,
• Compressed dry air,
• Process vacuum,
• Automated wafer transport systems,
• Computer integrated manufacturing (CIM)
systems,
• Gas leak detection systems,
• Exhaust abatement systems, and
• Bulk chemical delivery system.
7.4.4 Since the supplied utility power quality effects
all the equipment within the factory, performance
requirements for support equipment and facilities
infrastructure equipment should be specified using the
same standards used for processing equipment.
Applying the same voltage sag susceptibility
specifications for semiconductor processing equipment
(see industry specification for semiconductor
processing equipment voltage sag immunity) to the
support equipment and the facilities infrastructure
equipment has the following benefits: (See Related
Documents section.)
a) Use of the same specification for all
equipment allows for consistency when
monitoring and conditioning for the effects of
voltage sag events.
b) The same performance verification test
methods as those used for processing
equipment can be applied to the support
equipment and facilities infrastructure
equipment.
7.4.5 Where it is inefficient to have support and/or
facilities infrastructure equipment supplied to meet the
same specifications as process equipment, the facility
electrical distribution system may be required to
compensate for any specification gap.
7.5 Monitoring Strategies
7.5.1 Use power disturbance monitors and/or digital
fault recorders to monitor voltage to detect compliance
(see IEEE 1159). Monitor current to identify
disturbance sources and assist in solutions.
7.5.2 Locate continuous monitoring at the electrical
utility service, all major facility electrical distribution
centers, and all critical equipment electrical points of
connection. Perform periodic monitoring for at least
one location of each equipment type in order to
characterize the electrical environment under normal
conditions (i.e., to create a baseline). Additional
monitoring should be performed when experiencing
unexplained operational problems. A comparison of
baseline data to monitored data for equipment
experiencing problems is recommended for evaluating
the power supplied to the equipment.
7.5.3 Provide time synchronization for multiple
monitors to allow for the correlation of a single voltage
sag event between all monitors.
7.5.4 In order to understand the impact, correlate
monitored voltage sag events with known wafer
processing effects within the process equipment.
7.6 Measuring and Modeling Strategies
7.6.1 A single voltage sag event originating outside
the factory will vary in magnitude and duration when
measured at differing locations throughout the facility.
This is largely due to differing lengths and type of
distribution conductors feeding equipment located
throughout the facility. In addition, the electrical
interactions of the reactive and non-linear elements of
equipment effect the voltage sag measurements.
7.6.2 Voltage sag events that originate within the
facility electrical distribution system will vary in
magnitude and duration when measured at differing
locations throughout the facility. These voltage sag
events are usually a result of a current flow increase and
the associated voltage drop across the conductors
between the source and load. The location along the
current flow path greatly effects the voltage sag
measured.
SEMI F49-0200 © SEMI 2000 6
7.6.3 Computer design tools should be used to model
the electrical distribution system in order to calculate
anticipated voltage sags for utility or site originated
faults. If limitations exist such that voltage sag
monitors are not located at every piece of equipment,
then event measurements can be adjusted from
modeling information to determine voltage sag values
at other locations.
7.6.4 As a means for measuring effectiveness in a
business environment, it would be useful to statistically
model the effect of voltage sag events on the
manufacturing processes. The variations mentioned in
Section 7.3.2, above, preclude a deterministic approach
to how well a wafer fabrication process will perform for
a given voltage sag event. A statistical correlation
model would aid in estimating the correlation between
voltage sags and manufacturing cost, and can be used to
validate the effectiveness of power enhancement and
conditioning programs.
7.6.5 Example of Voltage Sag Event Modeling
7.6.5.1 A voltage sag event originating on the
electrical utility system often exhibits different
characteristics when measured at different locations on
facility electrical distribution systems. The variance in
voltage sag characteristics can create different effects
on similar equipment. Variances can usually be
explained by examining 1) the characteristics of voltage
sag at the utility interfaces, 2) the type and connection
configuration of voltage transformations, and 3) the
voltage levels and corresponding phase relationships at
the terminals of infrastructure, support, and process
equipment within the facility.
7.6.5.2 The types of faults that can occur on a utility
system are:
• Line to line to line,
• Line to line to line to ground,
• Line to line,
• Line to line to ground, and
• Line to ground.
7.6.5.3 The utility network can be modeled to predict
the voltage sag characteristics due to various types of
faults at the electrical interfaces between a
semiconductor manufacturing facility and utility. The
most common utility system fault type is a single line to
ground fault. An example of the translation of a
voltage sag resulting from a line to ground voltage sag
event is provided in the following sections.
7.6.5.4 Typical voltage transformations from the
utility interface to utilization voltage levels are
illustrated in Figure 3. Under normal conditions, the
three phase voltages are all approximately equal and
displaced 120º from each other. During a voltage sag
event due to an unbalanced fault, this relationship
changes. Delta-wye transformers between the origin of
the fault and the equipment being studied will further
affect the phase and magnitude relationships. The
degree to which voltage phase shift and magnitude
changes occur at each transformation throughout the
facility distribution system should be considered when
examining impacts on individual equipment.
Transmission System
Medium Voltage Distribution System
138kV (L-L Nominal)
φ
C
φ
B
φ
A
Substation Transformer
First Step-down Transformer
Second Step-down Transformer
Low Voltage Distribution System
F
A
C
I
L
I
T
Y
U
T
I
L
I
T
Y
12.47 kV (L-L Nominal) 7.2 kV (L-N Nominal)
480 or 208 volt (L-L) 277 or 120 volt (L-N)
208 volt (L-L) 120 volt (L-N)
Figure 3
Typical Semiconductor Factory Voltage
Transformations
7.6.5.5 Figure 4 illustrates the variations in magnitude
of a voltage sag event within a facility during a single
line to ground fault on a utility transmission line. This
example illustrates a worst case situation, where a
single-phase fault occurs at a substation transformer
primary-side terminal. (See Related Documents
section.)
7.6.5.6 Many devices in process, support, and facilities
infrastructure equipment are not connected to all three
phases. Because the voltage sag response of these
devices may dictate the sag response for the entire
equipment assembly, understanding device connection
configuration and sag response characteristics is of
critical importance. Sag depth and duration, the point
on the wave at which the sag begins, and the
corresponding phase relationships are all known to be