semi合集-English.pdf - 第4612页
SEMI D41-0305 © SEMI 2005 3 7.2 Measurement Method 7.2.1 Warm-Up Time 7.2.1.1 Warm-up time is the period from power-on to saturation of th e light intensity. The optical measurement needs 15 to 30 minutes for more accura…

SEMI D41-0305 © SEMI 2005 2
5.3 Definitions
5.3.1 Dynamic Range — the divided ability from a minimum detecting level to a maximum detection level of a
CCD equipment.
5.3.2 Gray Scale — gray scale on an image display. This standard indicates level 32 out of 64 level gray scale.
5.3.3 L0 Display — gradation 0 out of 64. (Pitch Black)
5.3.4 L63 Display — gradation 63 out of 64 (Completely white)
5.3.5 Luminance Accuracy — the error ratio of the luminance.
5.3.6 Measuring points — the number of CCD sensors.
5.3.7 Semu — Semi Mura, Measurement index for Mura, defined in this standard. Please refer toSEMI D31.
5.3.8 Viewing direction — the angle between the CCD equipment and the test sample.
6 Related Definitions for Mura Measurement
6.1 Mura is a Japanese term meaning blemish and has been adopted in English to provide a name for imperfections
of the display pixel matrix surfaces that are visible when the display is in operation. Inspect the display surface
while displaying a white full screen, a black full screen, and a dark gray full screen (VESA FPDM 2.0). In many
case, the Mura phenomena is detected by human eyes. But this is very confusing in the quality aspect. And it is very
difficult to quantify the level.
6.2 The definition in SEMI D31 shows mainly that Luminance Mura is related with the size of Mura. Therefore this
standard will follow the Cjnd concept.
6.3 Semu Definition
6.3.1 Under specific conditions, the below regression function can explain the level of Mura between the area and
contrast for Human Mura JND. (Refer to SEMI D31.)
Cjnd = F (Sjnd) = 1.97/Sjnd
0.33
+ 0.72
Cjnd: Contrast of Mura at JND
(Unit: % relative to background = 100%)
Sjnd: The area of Mura at above contrast (Units: mm
2
)
6.3.2 In the above equation, contrast at JND is inversely proportional to the area raised to the 0.33 powers. In short,
it indicates that as Mura the area gets smaller, only darker Mura can be sensed.
6.3.2.1 For the subject Mura, the Mura level, Semu, can be calculated using the below formula.
Semu = |Cx| / Cjnd
= |Cx| / F (Sx)
= |Cx| /(1.97/Sx
0.33
+ 0.72)
Cx: Average contrast of Mura being measured (Unit: % relative to background = 100%)
Sx: The surface area of Mura being measured (mm
2
)
7 Measurement Method
7.1 Environment Conditions:
Temperature: 25 ± 2°C
Humidity: 65 ± 20% RH
Illumination of surrounding: in a dark room below 10 lux
Air flow: no wind
SEMI D41-0305 © SEMI 2005 3
7.2 Measurement Method
7.2.1 Warm-Up Time
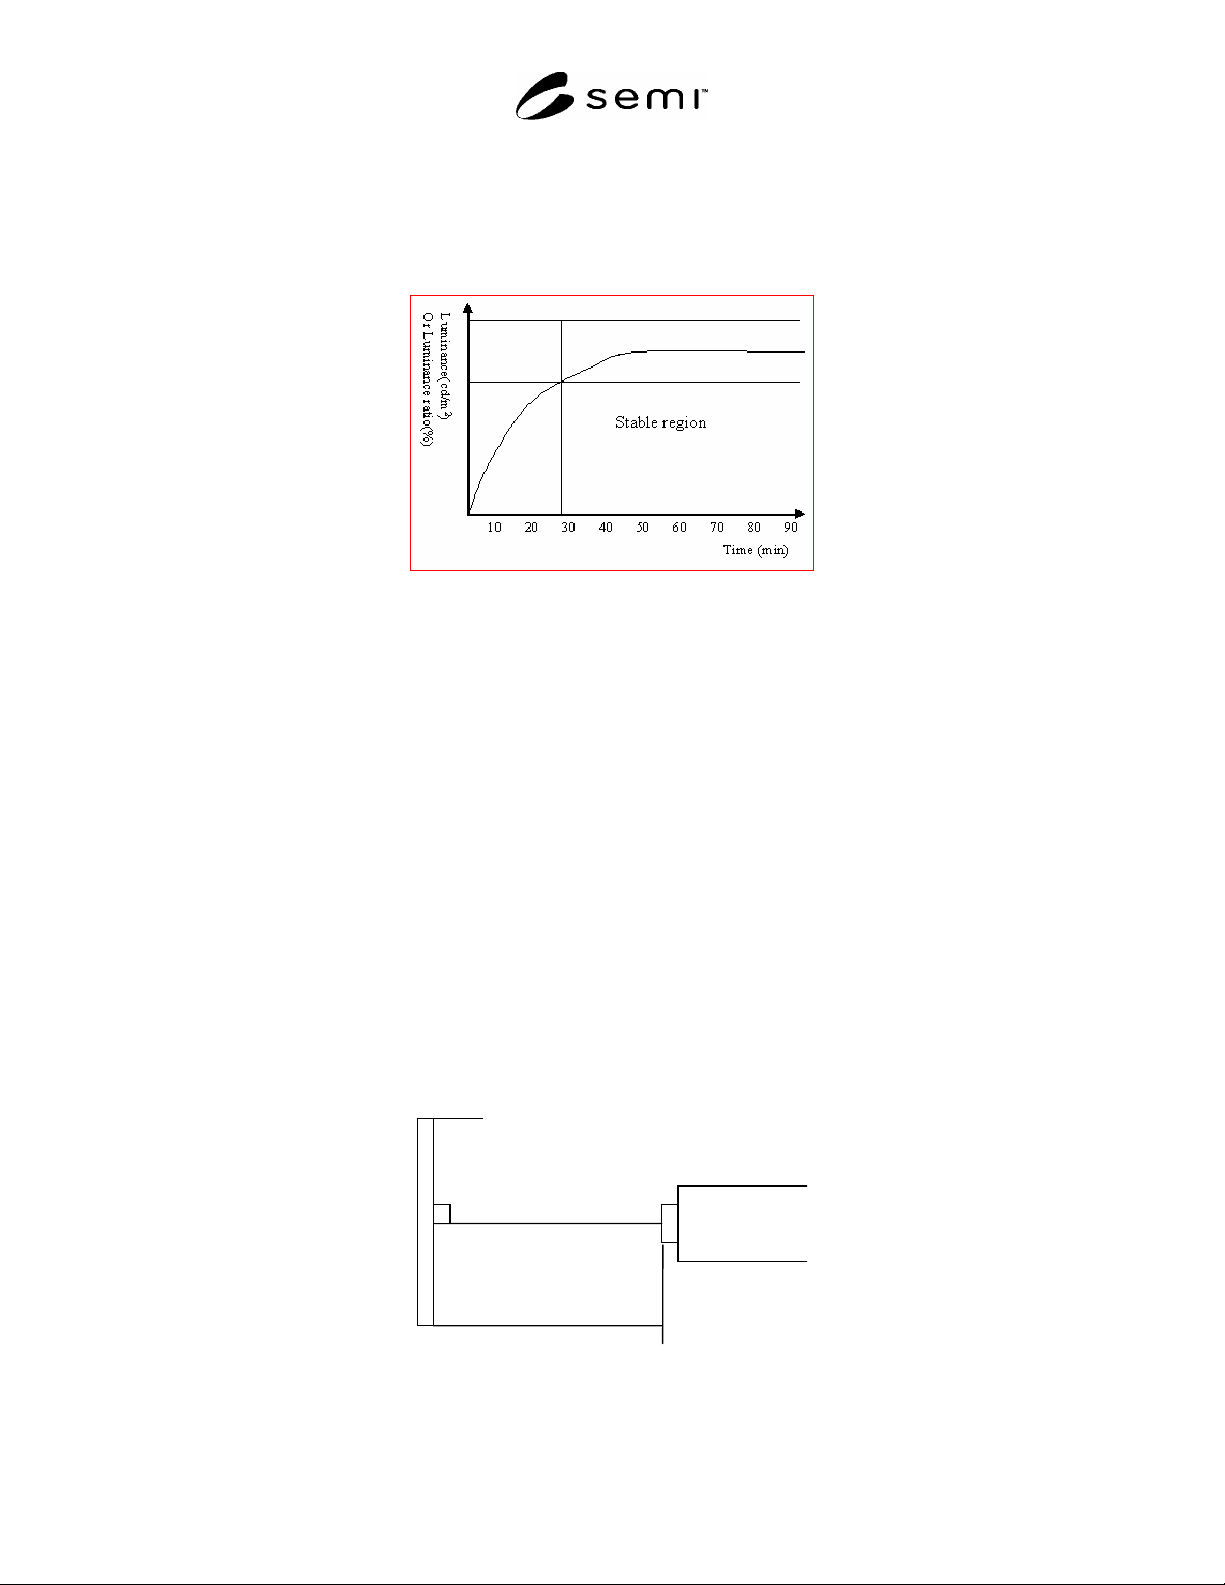
7.2.1.1 Warm-up time is the period from power-on to saturation of the light intensity. The optical measurement
needs 15 to 30 minutes for more accurate measurement. In case of Mura, it has a little luminance difference between
the luminance of Mura and the luminance of background the area. Therefore it must be measured in a saturate state.
Figure 1
General Warm-Up Characteristics
7.2.2 Light Measurement Device (LMD)
7.2.2.1 When human eyes measure the FPD, it is detected in the total active area. So the measuring equipments
must have similar characteristics to the human eye detecting method. In this standard, we recommend the CCD
equipments to detect the Mura phenomena.
1) Dynamic Range — The dynamic range of the CCD equipment should be over 12 bits because the Semu value
must be controlled by 0.1 Semu.
2) Luminance Accuracy — The Accuracy of Luminance is very important to measure Mura, because the Mura
value is determined by low luminance difference. Therefore the accuracy of luminance should be 0.01 cd/m
2
at the 100cd/m
2
.
3) Measuring Points — The measuring points should be over 200(H) X 200(V) points. It is the same as the
number of the CCD sensors.
7.2.3 Test Pattern for Semu Measurement
7.2.3.1 The test pattern should be set by 50 cd/m
2
in the white pattern. The permissible error is 10 cd/m
2
.
7.2.4 Viewing Direction
7.2.4.1 The viewing direction angle should be set 90° ± 1°.
90° ± 1°
DUT
LMD
Measuring Distance
Figure 2
Viewing Direction for the Semu Measurement
SEMI D41-0305 © SEMI 2005 4
7.2.5 Measuring Distance for Semu Measurement
7.2.5.1 Because we use a CCD Camera, the measuring distance is set by the same angle in all DUT. We standardize
the 15 display size and testing distance is 500 mm. But the testing distance should be different from each display
size.
7.2.5.2 In case of the 15 display, the angle from the center to the edge position can be calculated below.
)4.(..........
_
5.0_
tan
distanceMeasuring
distancediagonal
Therefore the reference angle is about 20.856° and then it can be calculated the measuring distance of all DUT.
)5...(
tan
5.0_
_
distancediagonal
distanceMeasuring
Table 1 Examples of Measuring Distance
Display Size
(in.)
14.1 15 17 18.1 20.1
Measuring Distance
(mm)
470 mm 500 mm 566 mm 603 mm 670 mm
#1 This measuring distance can have the same measuring angle in each different size sample.
7.2.6 Determination of the Threshold for the Mura Area
7.2.6.1 It is very important to calculate the Semu value. If some threshold values are different from each test
equipment, the Semu test results are different. Therefore we use the Cx value to determine the threshold value. In
this standard, when the Cx value is over 1.01, we can consider the Mura area.
7.2.7 Area Calculation Method
7.2.7.1 There are two main parameters for calculating the Semu value. The first one is the Cx value and the other is
the Sx value. The Sx value means that the surface area of Mura being measured. We can calculate the size of Mura
area with counting the number of pixels under the CCD equipment test.
7.2.8 Test Sample Pattern for the Sample Test
7.2.8.1 Originally, the test pattern should be set by 50 cd/m
2
in the white pattern. And the permissible error is 10
cd/m
2
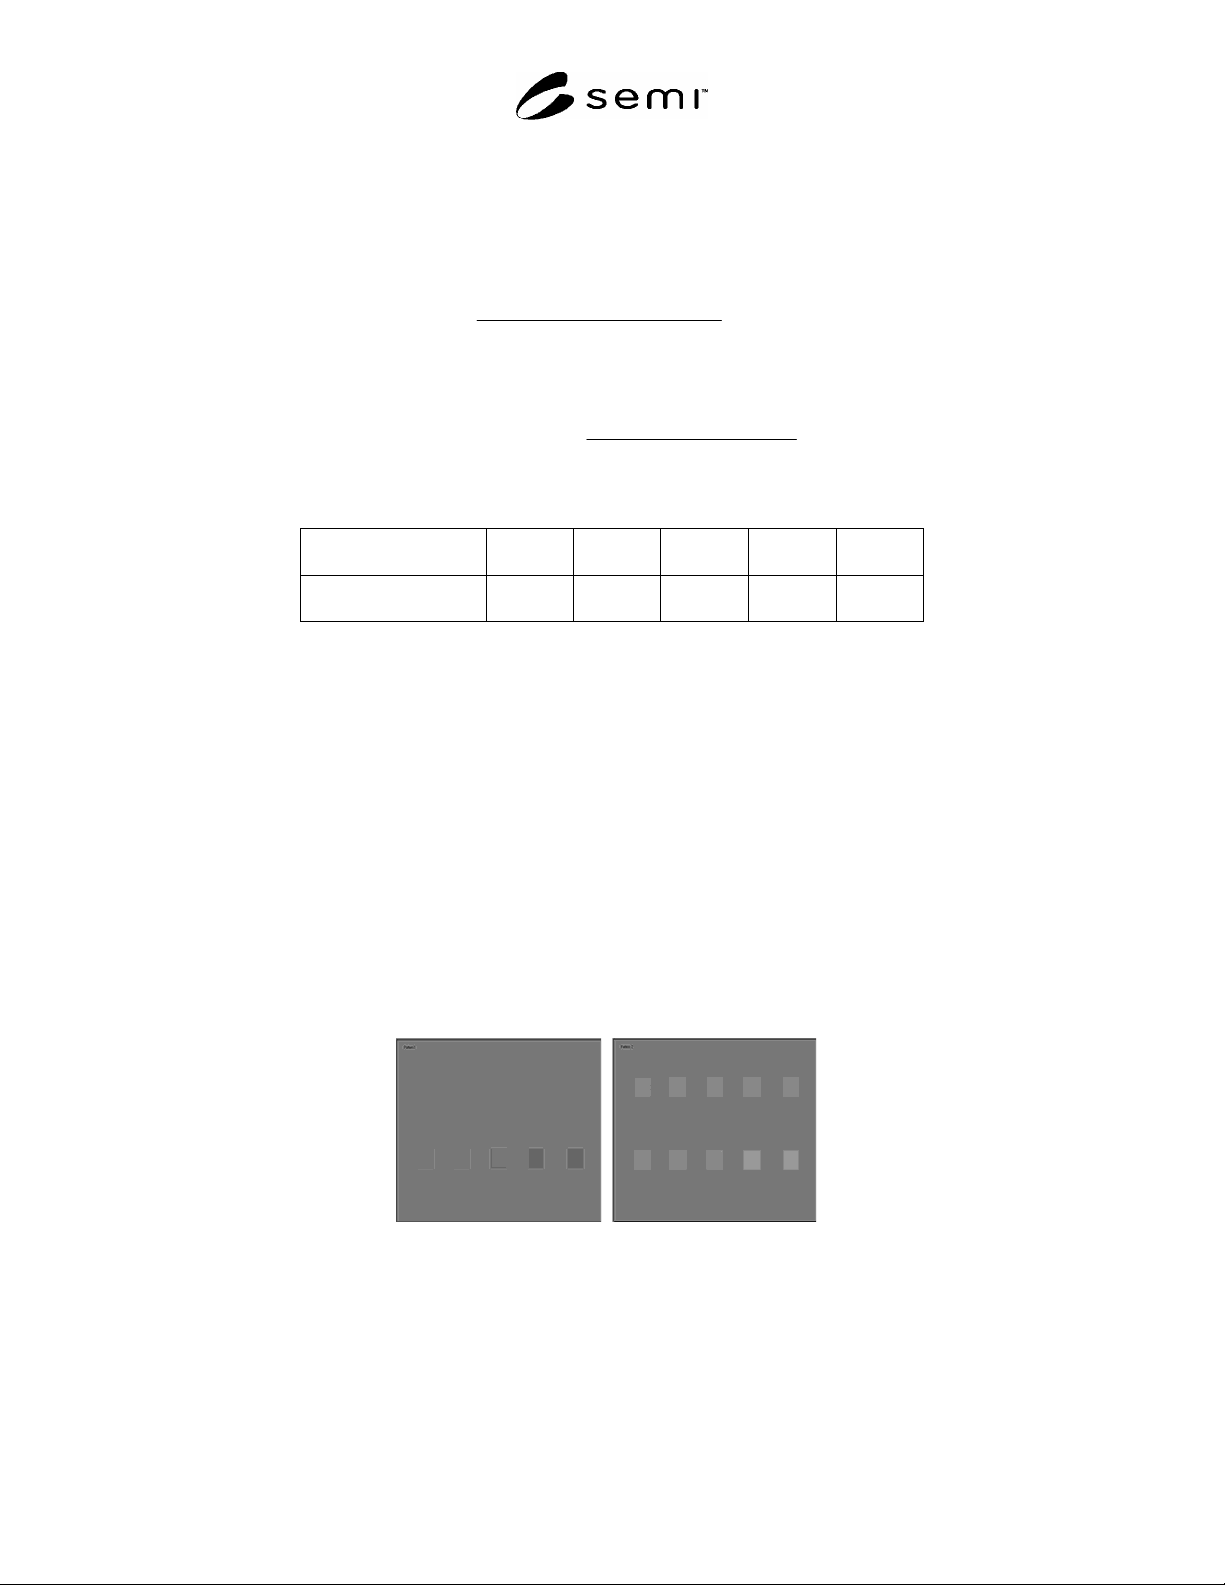
. But we use some artificial Mura test patterns for checking the sensitivity of the Semu parameter. The test
pattern has 10 Muras in Figure 3. Each Mura has a different gray level. In Figure 3, the left one shows darker Mura
patterns, and the right one shows brighter Mura patterns.
Figure 3
Test Patterns for Mura
7.2.9 Test Results for the Sample Patterns
7.2.9.1 Table 2 shows that the actual results for the darker Mura test pattern and Table 3 is for the brighter Mura
pattern. Figure 4 is a graphic information result for the dark Mura and Figure 5 is a graphic information result for the
bright Mura.