semi合集-English.pdf - 第4070页
SEMI F55-0600 © SEMI 2000 8 MFC Corri sion Test 0.71 0.72 0.73 0.74 0.75 0.76 0.77 0.78 0.79 0.8 0.81 0.82 0.83 0.84 0.85 0.86 0.87 0.88 0.89 0 100 200 300 400 500 600 700 800 900 1000 110 0 1 200 1 300 1400 1500 1600 Te…
SEMI F55-0600 © SEMI 20007
APPENDIX 1
TEST REPORT CORROSION TEST
NOTE: The material in this appendix is an official part of SEMI F55 and was approved by full letter ballot procedures on April
10, 2000 by the North American Regional Standards Committee.
MFC Identification: Wxyz Instruments, Model 123, Serial 230967
Calibrated for: 100 scm
3
HCl
Reference Flowmeter: Mnop Company, Model 1023, Serial 37863, 100 sccm N
2
Test dates: March 28 to May 5, 1993
Test Laboratory: Flow Test and S.D. Associates, Inc.
Test supervised by: George Smith
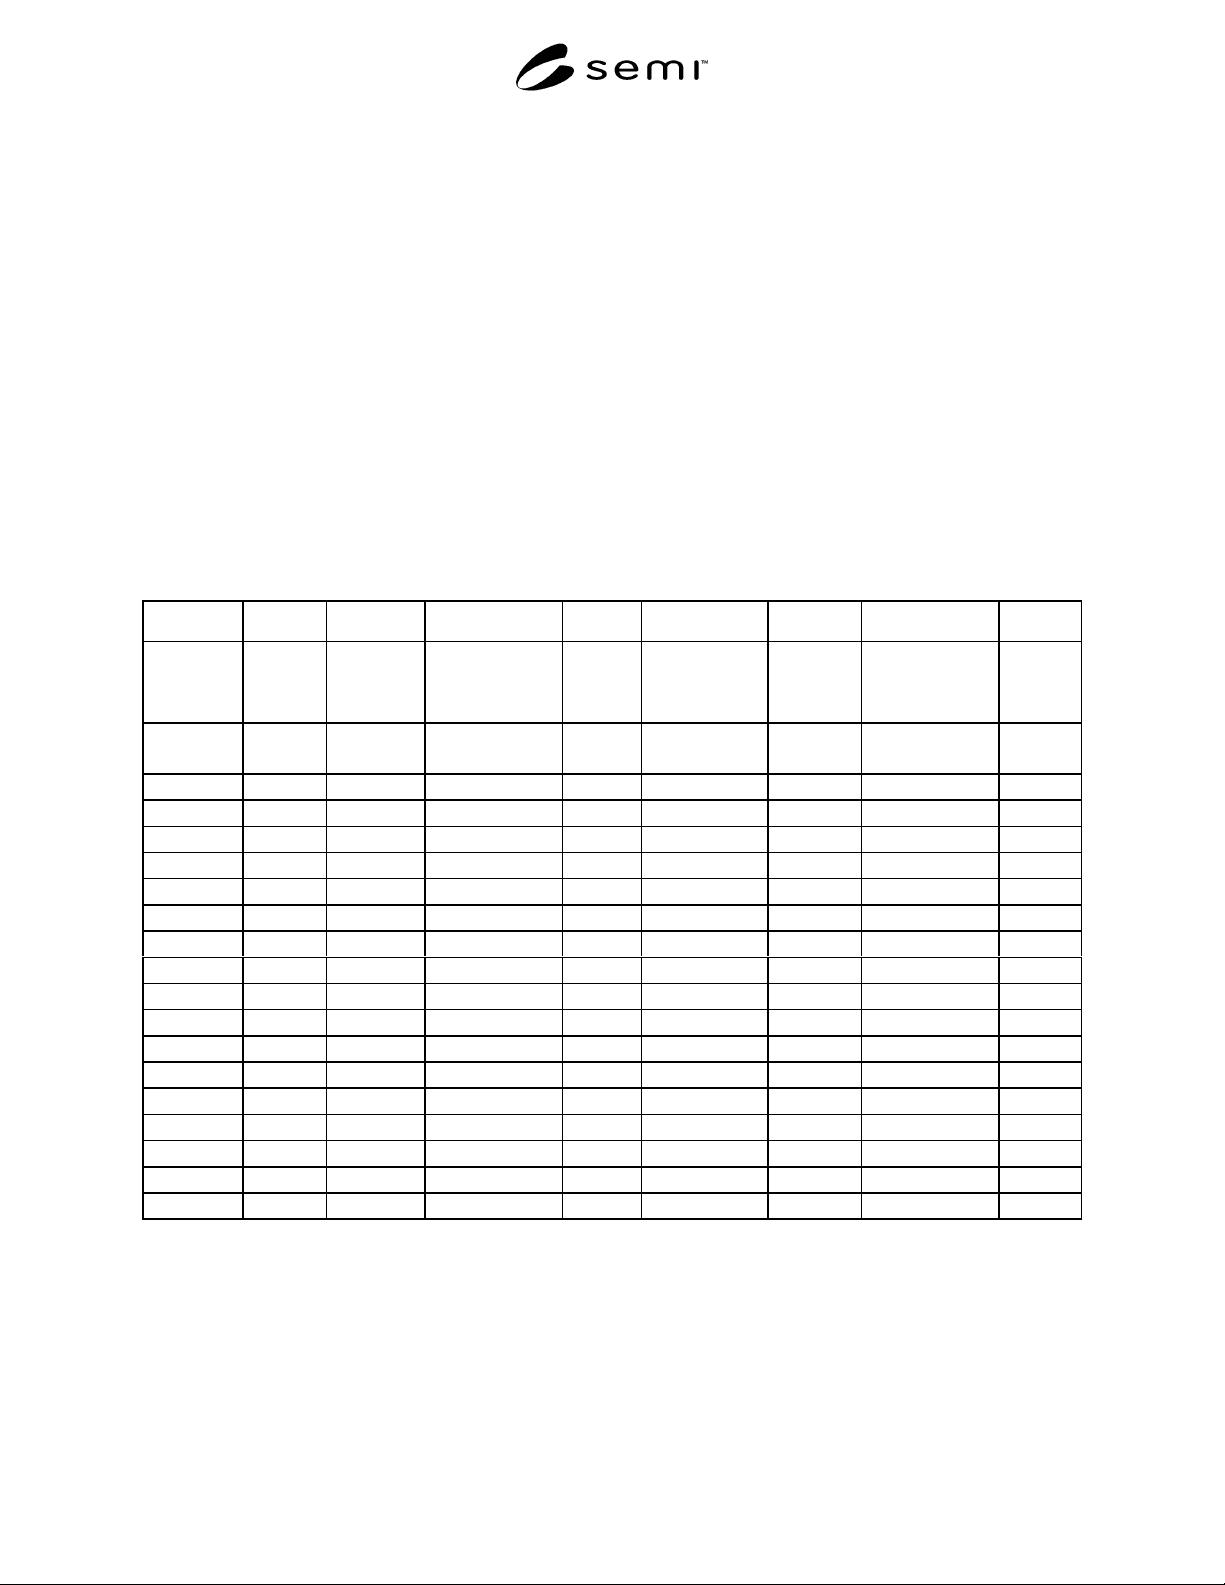
Table A1-1 Data in tabular format
ABC D E F G H J
TEST
CYCLE #
TEST
CYCLE
HOURS
DUT
SET-
POINT %
DUT
INDICATED %
DUT
ZERO
%
REFERENCE
FLOW ZERO
%
ACTUAL
FLOW %
CALIBRATION
SHIFT %
CHANGE
VALVE
DRIVE
VOLTS
base
line
base
line
75.04 75.05 -0.13 0.03 71.12 0.0 -7.062
100 50 75.01 74.8 0.14 0.04 71.56 0.6 -7.066
200 100 75.00 74.82 0.13 -0.04 71.38 0.4 -7
300 150 74.99 75.1 -0.01 -0.03 71.26 0.2 -7.056
400 200 75.02 75.01 0.02 0.01 71.3 0.3 -7.049
500 250 74.98 74.96 -0.01 -0.03 71.36 0.3 -7.009
600 300 75.02 74.96 0.00 0.03 71.18 0.1 -6.997
700 350 74.99 74.92 0.11 -0.04 71.32 0.3 -7.042
800 400 75.00 75.15 -0.06 -0.04 71.37 0.4 -7.010
900 450 75.02 74.9 0.04 0.01 71.69 0.8 -6.997
1000 500 74.99 75.01 -0.09 0.04 71.96 1.2 -7.056
1100 550 75.01 74.82 0.13 0.04 72.55 2.0 -7.136
1200 600 75.03 75.1 -0.13 -0.02 72.92 2.5 -7.100
1300 650 75.05 75.19 -0.15 -0.03 74.17 4.3 -7.277
1400 700 74.96 75.09 -0.12 -0.01 76.15 7.1 -7.348
1500 750 75.04 75.05 -0.09 -0.01 79.86 12.3 -7.666
1600 800 74.96 75.15 -0.13 0.05 88.36 24.2 -8.278
1700 850 74.96 74.99 0.03 -0.02 110.53 55.4 -9.732
SEMI F55-0600 © SEMI 2000 8
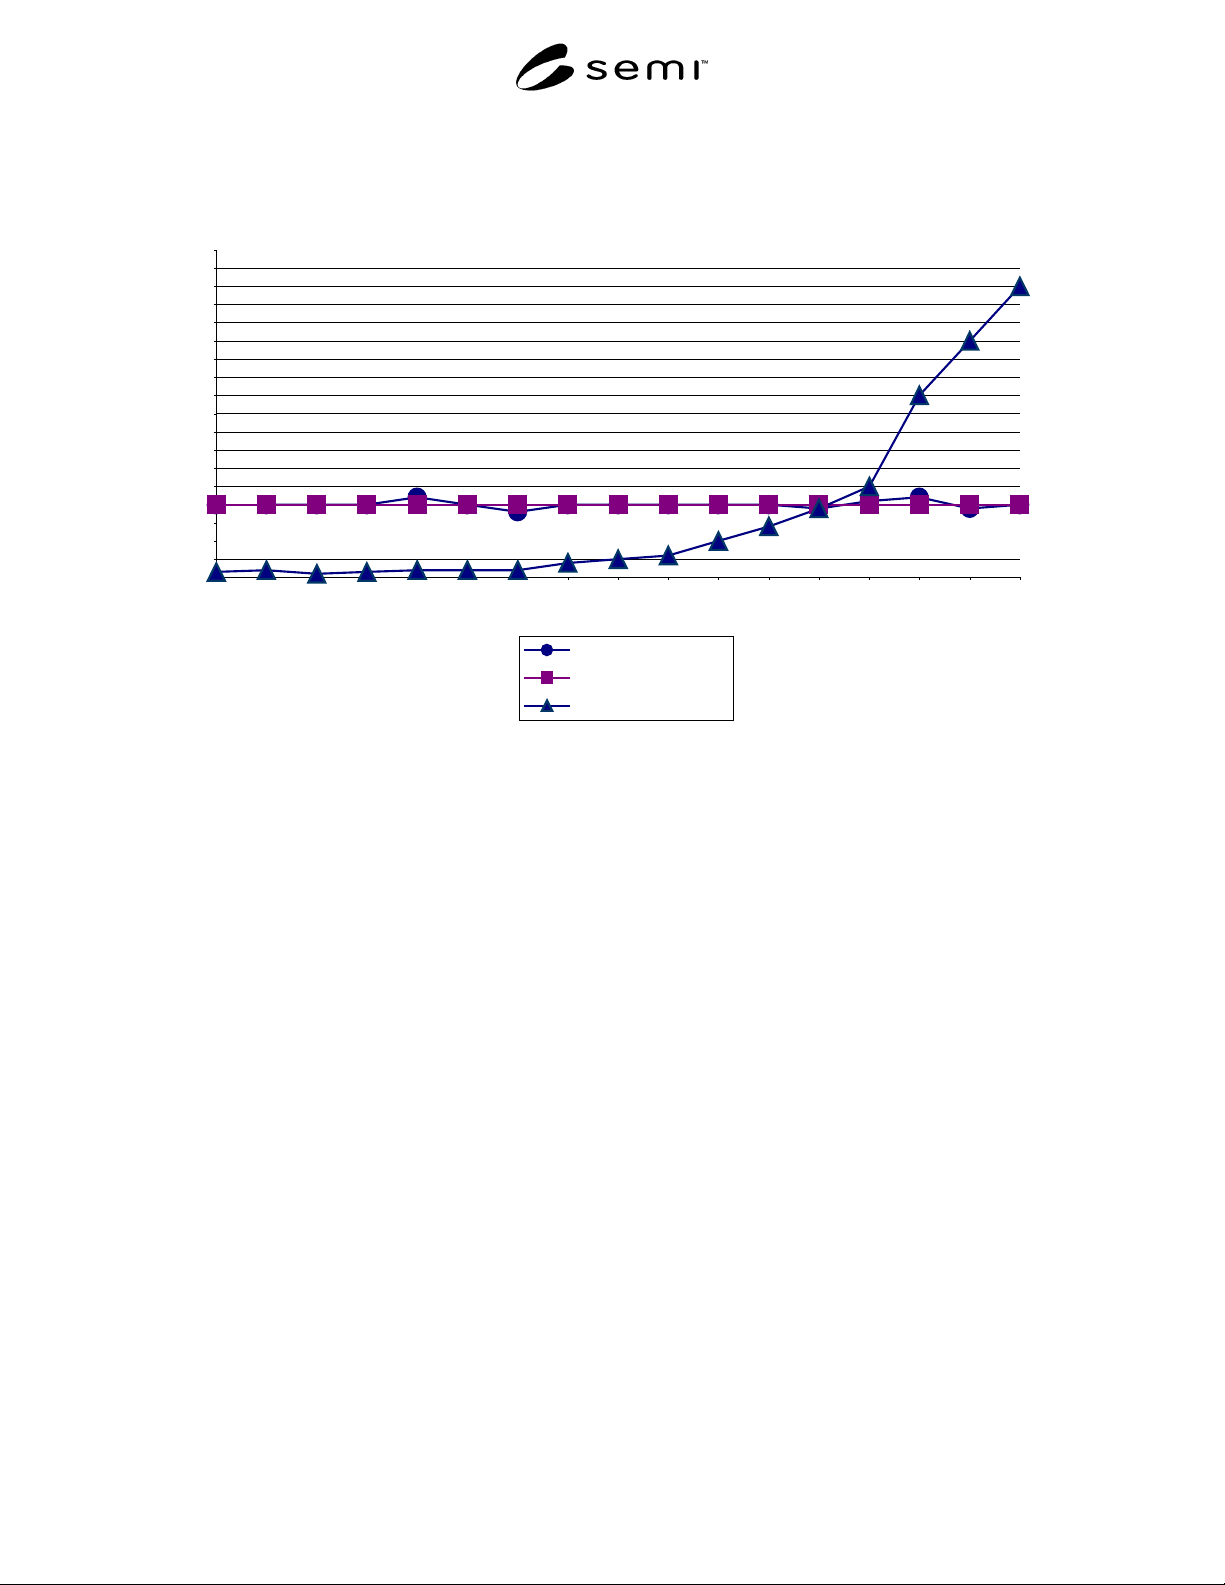
MFC Corrision Test
0.71
0.72
0.73
0.74
0.75
0.76
0.77
0.78
0.79
0.8
0.81
0.82
0.83
0.84
0.85
0.86
0.87
0.88
0.89
0 100 200 300 400 500 600 700 800 900 1000 1100 1200 1300 1400 1500 1600
Test Cycles Completed
Full Scale Percent
DUT Indicated Flow
DUT Setpoint
Actual Flow
Figure A1-1
Test Results Graph
NOTICE: SEMI makes no warranties or representations as to the suitability of the standard set forth herein for any
particular application. The determination of the suitability of the standard is solely the responsibility of the user.
Users are cautioned to refer to manufacturer’s instructions, product labels, product data sheets, and other relevant
literature respecting any materials mentioned herein. These standards are subject to change without notice.
The user’s attention is called to the possibility that compliance with this standard may require use of copyrighted
material or of an invention covered by patent rights. By publication of this standard, SEMI takes no position
respecting the validity of any patent rights or copyrights asserted in connection with any item mentioned in this
standard. Users of this standard are expressly advised that determination of any such patent rights or copyrights, and
the risk of infringement of such rights, are entirely their own responsibility.
Copyright by SEMI® (Semiconductor Equipment and Materials
International), 3081 Zanker Road, San Jose, CA 95134. Reproduction o
f
the contents in whole or in part is forbidden without express written
consent of SEMI.

SEMI F56-0600 © SEMI 20001
SEMI F56-0600
TEST METHOD FOR DETERMINING STEADY-STATE SUPPLY
VOLTAGE EFFECTS FOR MASS FLOW CONTROLLERS
This test method was technically approved by the Global Facilities Committee and is the direct responsibility
of the North American Facilities Committee. Current edition approved by the North American Regional
Standards Committee on April 10, 2000. Initially available on www.semi.org May 2000; to be published
June 2000.
1 Purpose
1.1 The purpose of this document is to define a
method for characterizing mass flow controllers
(MFCs) being considered for installation into a high-
purity gas distribution system. This method will
quantify the steady-state supply voltage effects on the
MFC's ability to accurately deliver set point flow
values.
2 Scope
2.1 This procedure applies to thermal mass flow
controllers. It is intended to measure the delivered
mass flow rate variation as a function of deviation from
the reference steady-state supply voltage. The test
method is designed for DC-powered MFCs. The
supply voltage effects include voltage depression and
over-voltage variations in the DC supply.
2.2 This standard does not purport to address safety
issues, if any, associated with its use. It is the
responsibility of the users of this standard to establish
appropriate safety and health practices and determine
the applicability of regulatory limitations prior to use.
3 Limitations
3.1 This test method is not designed for AC-powered
MFCs. This test method addresses steady-state effects
and does not address any effects caused by transient
power supply behavior.
4 Referenced Standards
4.1 None.
5 Terminology
5.1 Acronyms and Abbreviations
5.1.1 DUT — device under test
5.1.2 MFC — mass flow controller
5.1.3 NIST — National Institute of Standards and
Technology
5.1.4 psia — pounds per square inch absolute
5.1.5 psig — pounds per square inch gauge
5.2 Definitions
5.2.1 actual flow — flow value measured by the flow
standard.
5.2.2 indicated flow — flow value derived from the
MFC.
5.2.3 Reference voltage(s) — manufacturer's recom-
mended power supply voltage(s).
5.2.4 stable — the state a signal level obtains when its
magnitude varies by less than or equal to ±2.0% of full
scale over a one-minute period.
6 Summary of Method
6.1 This test method consists of varying the steady-
state supply voltage to an MFC in ±1% (of rated
supply) increments from the reference voltage span.
Both the positive and negative supply voltages will be
varied independently and together in 1% increments.
The MFC flow output is monitored at 0% and 100% of
its operating range (see Table 1). At each incremental
change as well as at the reference supply voltage, the
MFC flow and flow standard outputs are recorded at
0% and 100% of its operating range. The test shall end
when a ±3% of full-scale output flow change is noted
between the flow at the reference voltage and at an
incremental change point. A flow chart outlines the
procedure (see Figure 1).
7 Interference’s
7.1 Because of fluctuations in ambient temperature or
a changing load on the power supply, the reference
steady-state supply voltages may change. These
changes in supply voltages may adversely effect the
MFC's ability to deliver setpoint flow. The magnitude
of this effect can be measured by this test method.
7.2 The user of an MFC can use the data generated by
this method to evaluate the impact of steady-state
supply voltage variations on the MFC's ability to
deliver setpoint flow values. Knowing the magnitude
of this effect and the power level variations, allows the
user to decide on what measures to take to reduce this
effect, if necessary.