semi合集-English.pdf - 第692页
SEMI E89-1104 E © SEMI 1999, 2004 19 RELATED INFORMATION 5 EXAMPLE OF A MEASUREMENT SY STEM ANALYSIS WITH DAY AND LOAD ONLY NOTICE : This related information is not an o fficial pa rt of SEMI E89. It was deri ved from ta…
SEMI E89-1104
E
© SEMI 1999, 2004 18
R4-2.10.2 Because this is far above the generally
acceptable maximum value of 30% for a suitable MS, it
might not be suitable for some applications.
Improvement activities would begin with an
investigation of why the Wafer Day sigma is so large.
This term indicates differences between the ways
certain wafers vary from day to day (stability
differences between wafers).
R4-2.11 The actual measurement data obtained in this
example MSA is provided in Table R4-4. It may be
useful for working through the calculations in this MSA
either using statistical analysis software or manually to
confirm understanding.
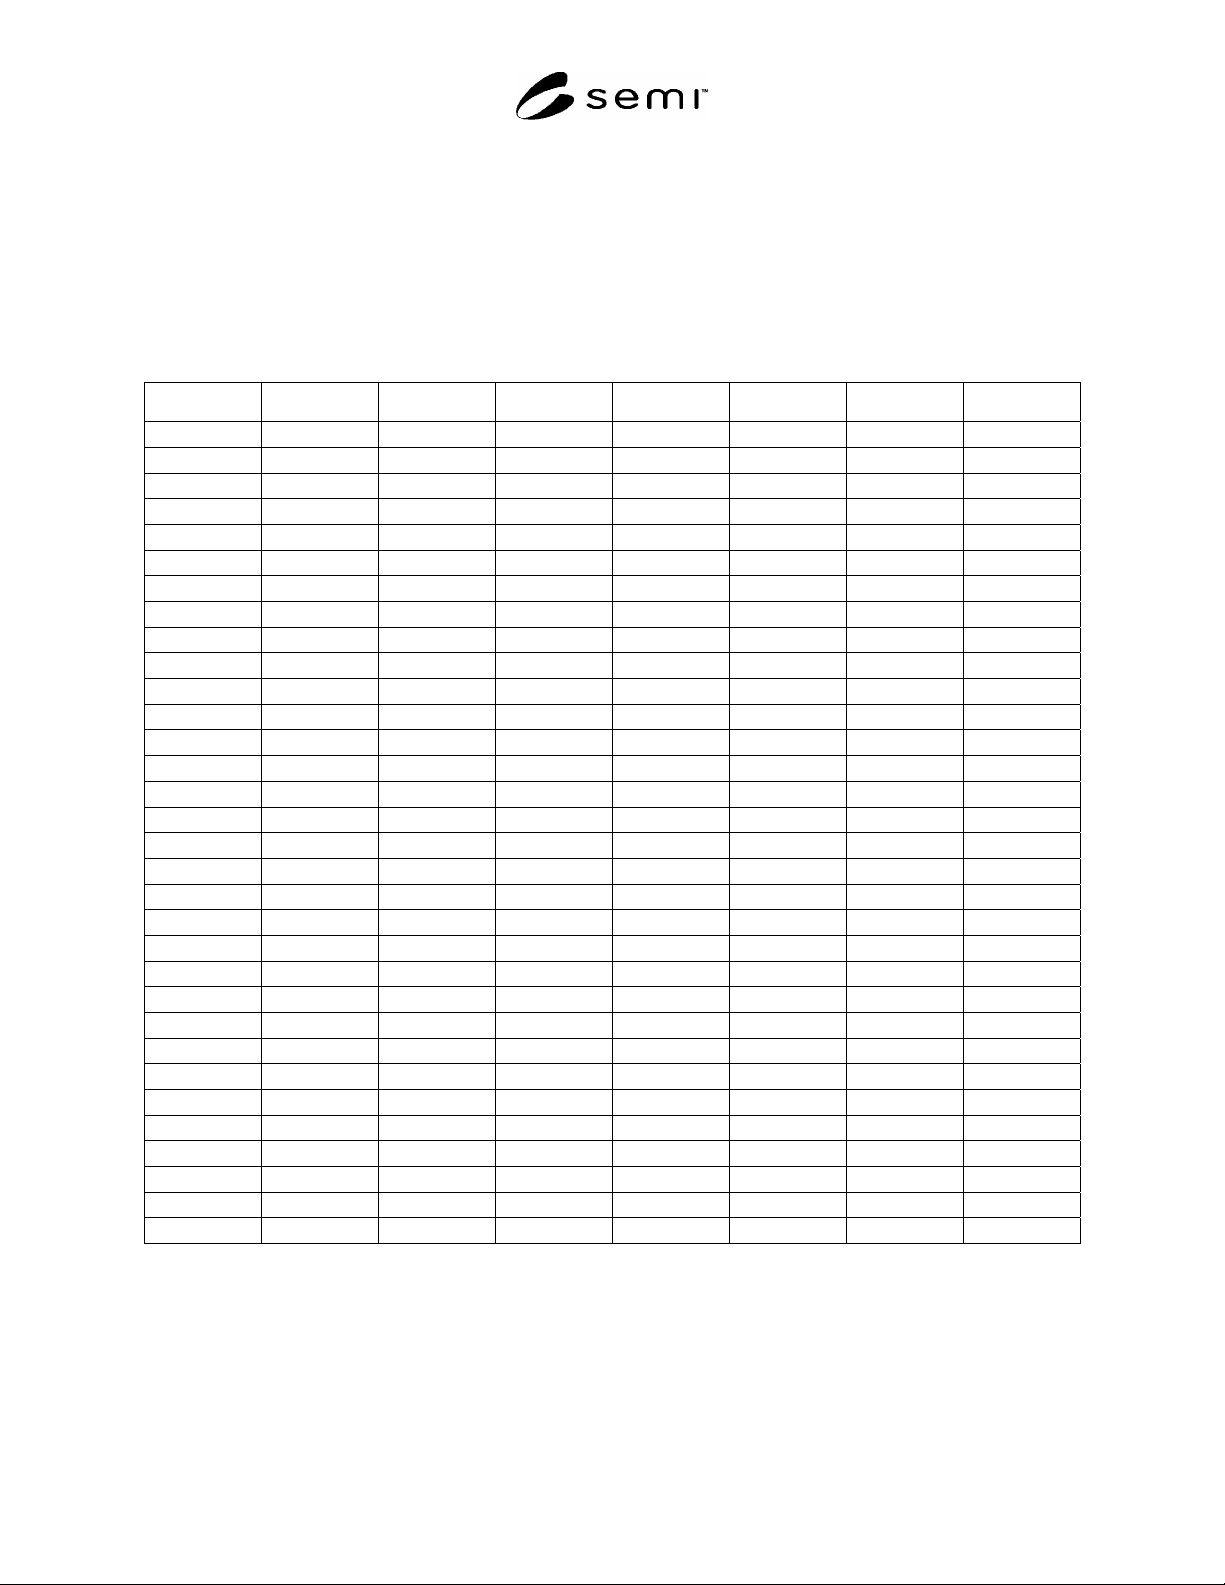
Table R4-4 Measurement Data (Average of Measurements Taken at Three Points Each Time) in Example MSA
Day Cycle Repeat Wafer 1 Wafer 2 Wafer 3 Wafer 4 Wafer 5
1 1 1 48.747 980.007 7,907.71 2,576.78 13,061.50
1 1 2 49.603 980.050 7,906.78 2,576.66 13,059.92
1 2 1 49.273 979.623 7,906.18 2,577.14 13,064.28
1 2 2 49.200 979.770 7,906.87 2,577.06 13,062.84
2 1 1 47.187 980.260 7,906.94 2,576.50 13,034.58
2 1 2 47.613 980.303 7,906.60 2,576.59 13,032.42
2 2 1 48.500 980.840 7,906.85 2,576.87 13,033.23
2 2 2 48.560 980.567 7,906.35 2,576.74 13,032.46
3 1 1 47.270 983.120 7,907.46 2,577.35 13,017.89
3 1 2 47.367 983.083 7,909.03 2,577.58 13,016.72
3 2 1 47.550 982.987 7,909.45 2,577.68 13,020.23
3 2 2 47.530 982.870 7,909.67 2,577.48 13,019.89
4 1 1 46.373 982.420 7,909.09 2,576.53 13,000.94
4 1 2 45.913 982.520 7,908.90 2,576.89 12,999.77
4 2 1 47.380 982.210 7,908.35 2,576.84 12,996.04
4 2 2 47.340 982.220 7,908.96 2,577.26 12,995.51
5 1 1 44.457 982.080 7,907.22 2,576.54 12,963.97
5 1 2 44.690 982.020 7,907.36 2,576.21 12,962.29
5 2 1 44.563 981.963 7,907.77 2,576.67 12,963.52
5 2 2 44.613 982.120 7,906.02 2,576.58 12,962.83
6 1 1 45.753 982.200 7,906.16 2,576.42 12,949.45
6 1 2 45.317 982.207 7,904.74 2,576.29 12,948.40
6 2 1 45.030 982.013 7,903.42 2,576.39 12,949.32
6 2 2 45.880 981.837 7,904.56 2,576.33 12,948.96
7 1 1 42.460 981.393 7,904.80 2,575.98 12,938.10
7 1 2 43.350 981.743 7,904.26 2,576.16 12,936.95
7 2 1 44.060 981.770 7,903.59 2,576.05 12,936.02
7 2 2 43.983 981.720 7,903.71 2,576.30 12,934.25
8 1 1 45.783 982.300 7,905.23 2,576.07 12,934.40
8 1 2 46.440 982.420 7,905.62 2,576.56 12,932.71
8 2 1 45.907 982.653 7,905.69 2,576.30 12,930.05
8 2 2 46.573 982.320 7,905.61 2,576.29 12,927.99
SEMI E89-1104
E
© SEMI 1999, 2004 19
RELATED INFORMATION 5
EXAMPLE OF A MEASUREMENT SYSTEM ANALYSIS WITH DAY AND
LOAD ONLY
NOTICE: This related information is not an official part of SEMI E89. It was derived from task force deliberations
during the revision of SEMI E89-0999 in 2001-2003. This related information was approved by full letter ballot
procedures and was approved for publication by the NA RSC on August 16, 2004.
R5-1 Introduction
R5-1.1 The following example illustrates how an MSA
is performed for a hypothetical measurement instrument
where only day and load are considered. Hand
calculations are provided and possible because the data
are balanced (i.e., each load has the same number of
repeated measurements). Rounding of value may cause
results may vary slightly. The data are shown in Table
R5-1.
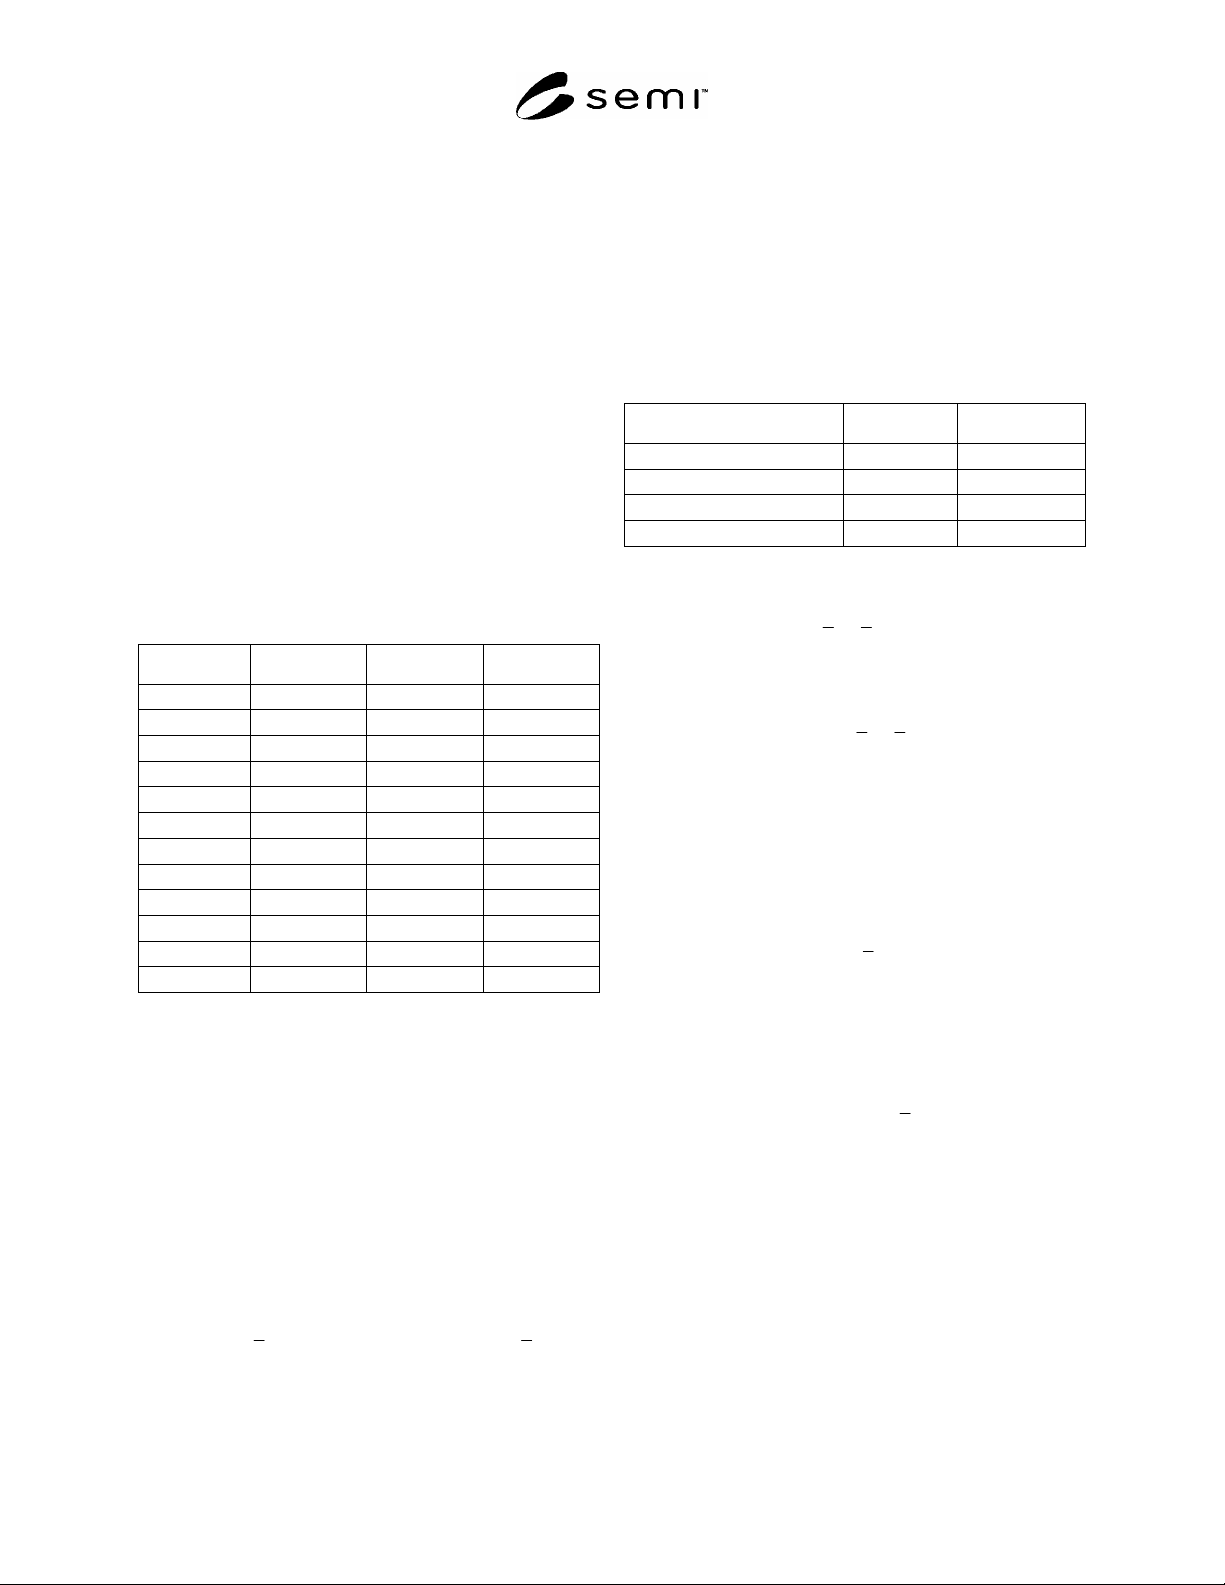
Table R5-1 Data for MSA with Load and Repeat
Repeat Load 1 Load 2 Load 3
1 593.46 593.43 594.11
2 593.15 594.22 594.03
3 592.87 593.63 593.92
4 593.25 592.73 593.2
5 593.43 592.98 593.16
6 593.21 593.18 593.41
7 593.08 592.74 593.57
8 593.68 592.65 593.46
9 593.06 592.69 592.7
10 592.68 593.38 593.42
11 593.20 593.86 593.5
12 593.00 593.27 593.39
The model for the MSA is
Y
ij
=
+ l
i
+ r
ij
(R5-1)
Y
ij
= measurement on the i
th
load and j
th
repeat,
= true value of the measurand,
l
i
= error term associated with the i
th
load, and
r
ij
= error term associated with the i
th
load, j
th
repeat.
R5-1.2 Load and Repeat are treated as random effects.
Repeat is nested within Load.
R5-2 Analysis
R5-2.1 Calculate the mean over all observations (the
grand mean,
Y
) and the mean for each load (
i
Y
).
Table R5-2 Mean by Load and Grand Mean
N Obs Mean
Load 1 12 593.17
Load 2 12 593.23
Load 3 12 593.49
Grand Mean 36 593.30
R5-2.2 Calculate the Sum of Squares for Load (SS
L
):
3
2
1
12 0.6830
Li
i
SS Y Y
(R5-2)
R5-2.2.1 In general, the formula for SS
L
is
2
1
L
Li
i
SS n Y Y
(R5-3)
where
n = number of repeats per load and,
L = number of loads.
R5-2.3 Calculate the Sum of Squares for Repeatability
(SS
r
):
12 3
2
11
5.2911
riji
ji
SS Y Y
(R5-4)
where:
ij
Y = observation for the i
th
load, j
th
repeat.
R5-2.3.1 In general, the formula for SS
r
is
2
11
nL
riji
ji
SS Y Y
(R5-5)
R5-2.4 Calculate the degrees of freedom for Load (df
L
)
as L – 1. Calculate the degrees of freedom for
repeatability (df
r
) as L(n – 1).
SEMI E89-1104
E
© SEMI 1999, 2004 20
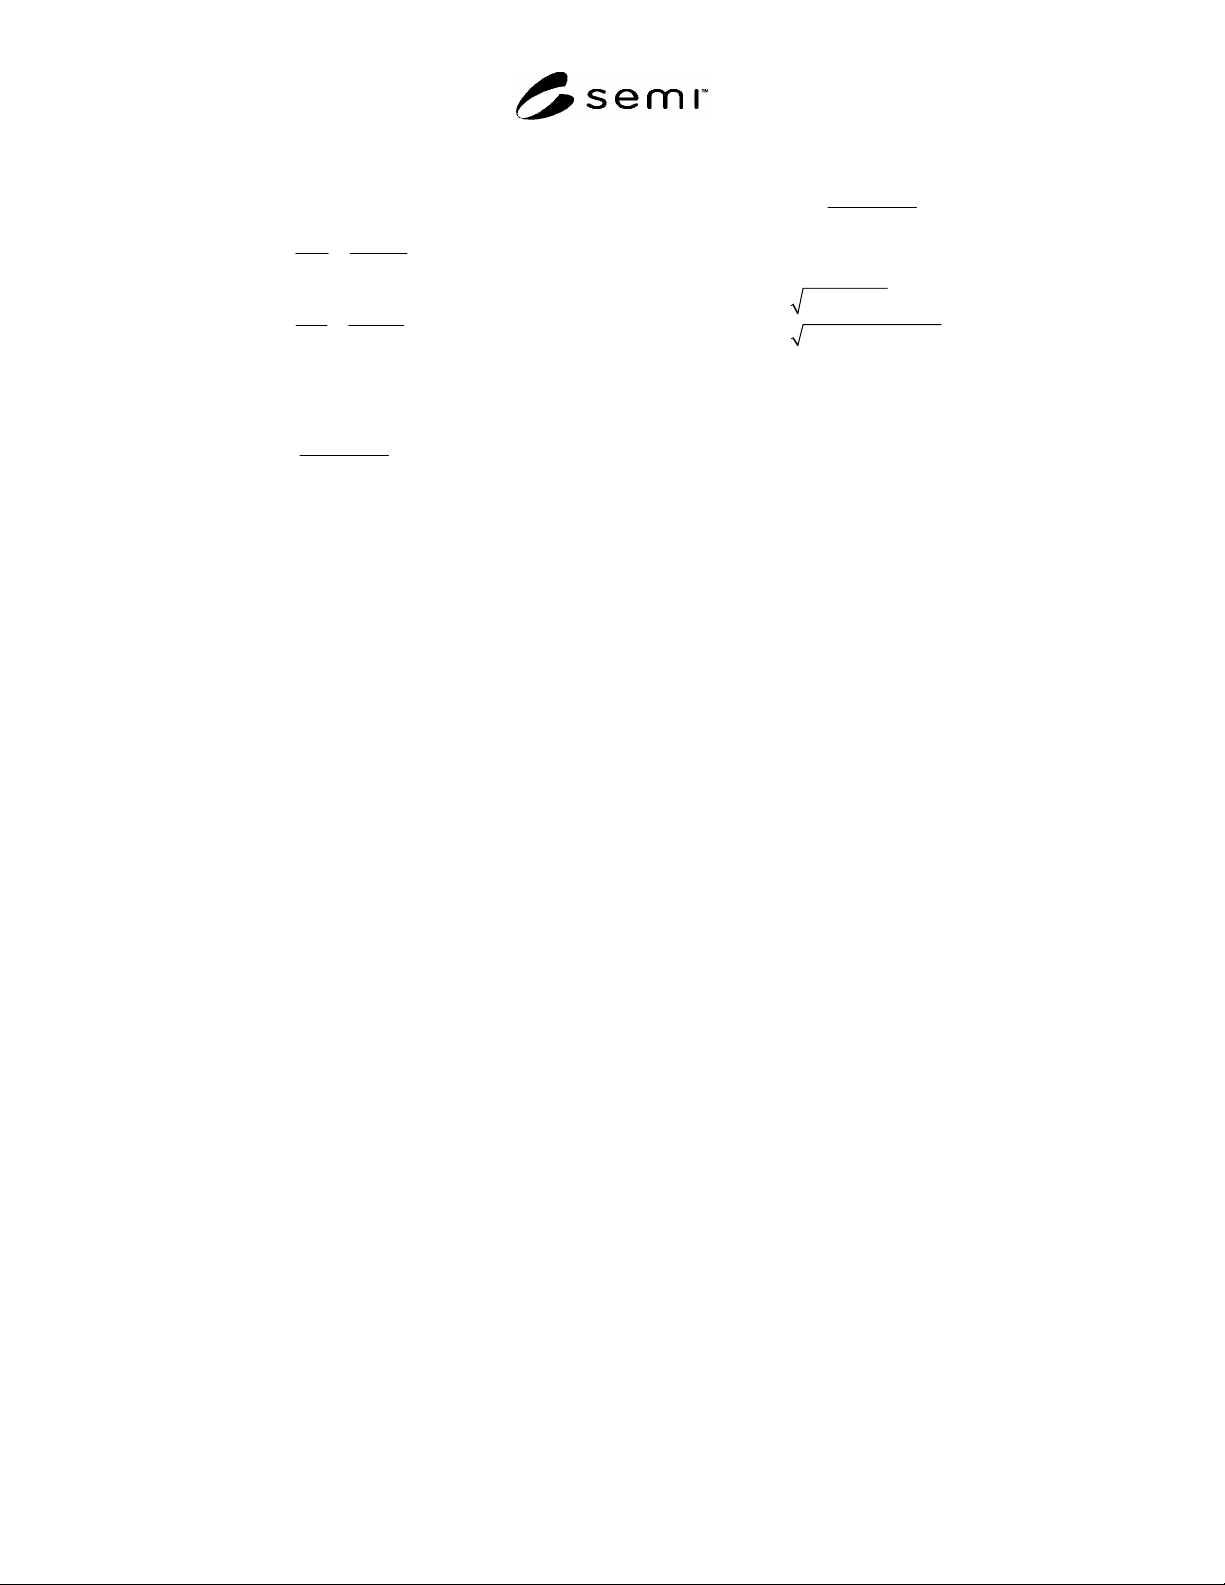
R5-2.5 Calculate the Mean Squares for both Load
(MS
L
) and Repeat (MS
r
) as the Sum of Squares divided
by degrees of freedom:
0.6830
0.3415
2
L
L
L
SS
MS
df
(R5-6)
5.2911
0.1603
33
r
r
r
SS
MS
df
(R5-7)
R5-2.6 The variance component for Repeatability
(VC
r
) is MS
r
. The variance component for Load is
0.01510
12
Lr
L
MS VC
VC
(R5-8)
R5-2.6.1 In general, the formula for VC
L
is
L
r
L
M
SVC
VC
n
(R5-9)
R5-2.7
Reproducibility is
0.1603 0.01510
0.4188
rrL
VC VC
(R5-10)