semi合集-English.pdf - 第7260页
SEMI MF657-0705 © SEMI 2003, 2005 6 values. Observe the plotted poi nts. If all points fall on or w ithin the limit lines , accept the apparatus as satisfying the linearity requirement for the test (see Figure 3). 9.2 Ve…
SEMI MF657-0705 © SEMI 2003, 2005 5
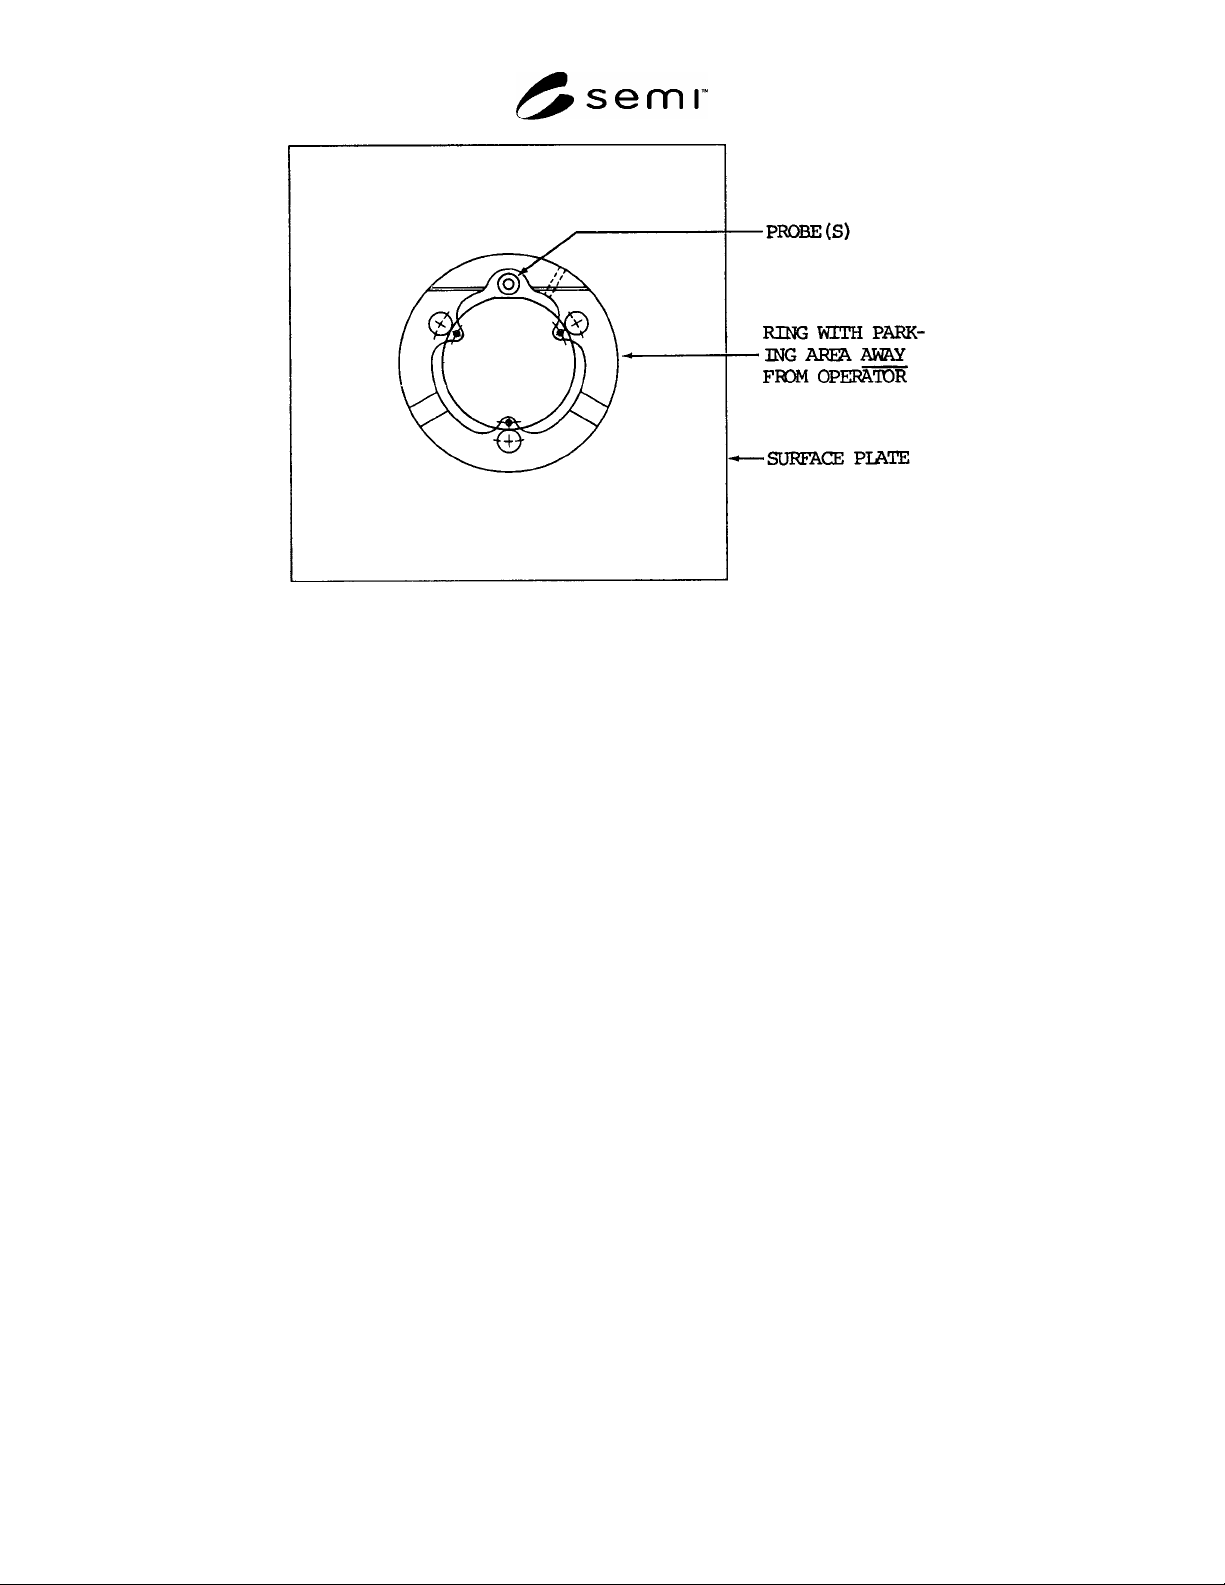
Figure 2
Orientation of Reference Ring
7.3 Set-up Thickness Masters — Covering a range equal to the nominal thickness of the wafer to be tested ±125 m
(or 0.005 in.), in approximately 50 m (or 0.002 in.) steps (a total of 6 masters). Each master shall have surfaces
flat to within 250 nm (or 10 in.) and a thickness variation no greater than 1.25 m (or 50 in.). The thickness of
each master shall be known to within 1.25 m (or 50 in.). The diameter of each master shall be suitable for the
ring with which it will be used.
NOTE 6: Silicon wafers satisfying the above requirements may be used as set-up thickness masters.
7.4 Precision Metal Flat — Of the same nominal diameter as the wafer to be tested and with one surface flat to 0.2
m (or 8 in.) TIR, maximum. The thickness of the flat shall be such as to permit the flat to be placed and
measured in the specimen position (see ¶9.2).
8 Sampling
8.1 This test method is nondestructive and may be used on either a 100% or a sampling basis.
8.2 If samples are to be taken, procedures for selecting the sample from each lot of wafers to be tested shall be
agreed upon by the parties to the text, as shall the definition of what constitutes a lot.
9 Calibration and Standardization
9.1 Through measurements on set-up thickness masters sized according to the nominal diameter of the intended
specimen wafer (see ¶7.3), calibrate and qualify the apparatus as follows:
9.1.1 If not already assembled, assemble the apparatus with the selected reference ring, corresponding to the
intended specimen size, on the surface plate and the guide in position to limit ring movement. Make sure that the
probes are in the parking position and that the position is away from the operator (see Figure 2).
9.1.2 Make, record, and analyze measurements on each selected setup thickness master in turn, in accordance with
the manufacturer's instructions or in accordance with the sections on procedure and calculations (§10 and Figure 4).
Position the ring so that the probes are in the parking position before inserting or removing a master.
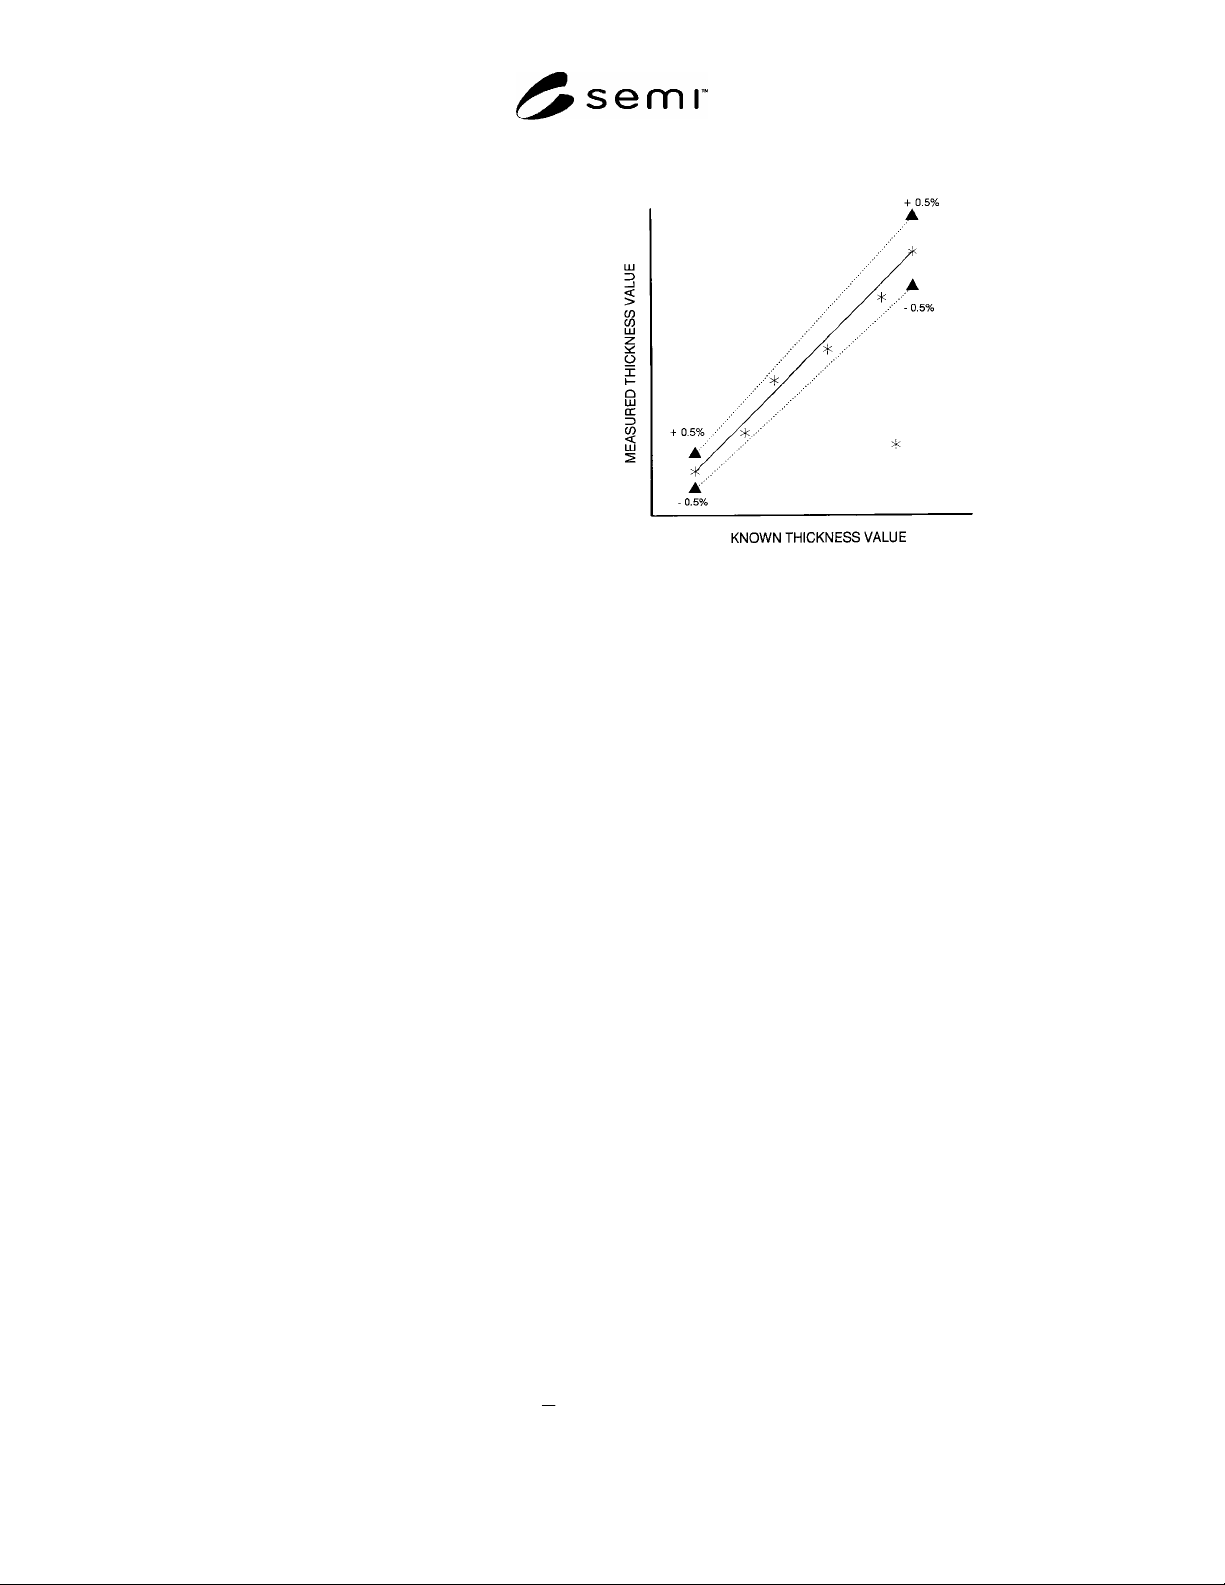
9.1.3 Construct a plot of measured thickness of each master as a function of known thickness. Draw a straight line
through the end points. At each end point, plot two additional points representing values of +0.5% and 0.5% of the
end point values. Draw a limit line through the two +0.5% values. Draw another limit line through the two 0.5%
SEMI MF657-0705 © SEMI 2003, 2005 6
values. Observe the plotted points. If all points fall on or within the limit lines, accept the apparatus as satisfying
the linearity requirement for the test (see Figure 3).
9.2 Verify that the specified requirement is met for
parallelism of the plane defined by the reference ring
and the working surface of the surface plate.
9.2.1 Set up the equipment to accept the flat. Insert
the precision metal flat in the specimen position (if
one side of the flat is known to be flatter than the
other, insert the flat with that side facing the surface
plate).
9.2.2 Measure and record the distance between the
bottom probe and the bottom surface of the precision
flat as the flat is scanned in accordance with the
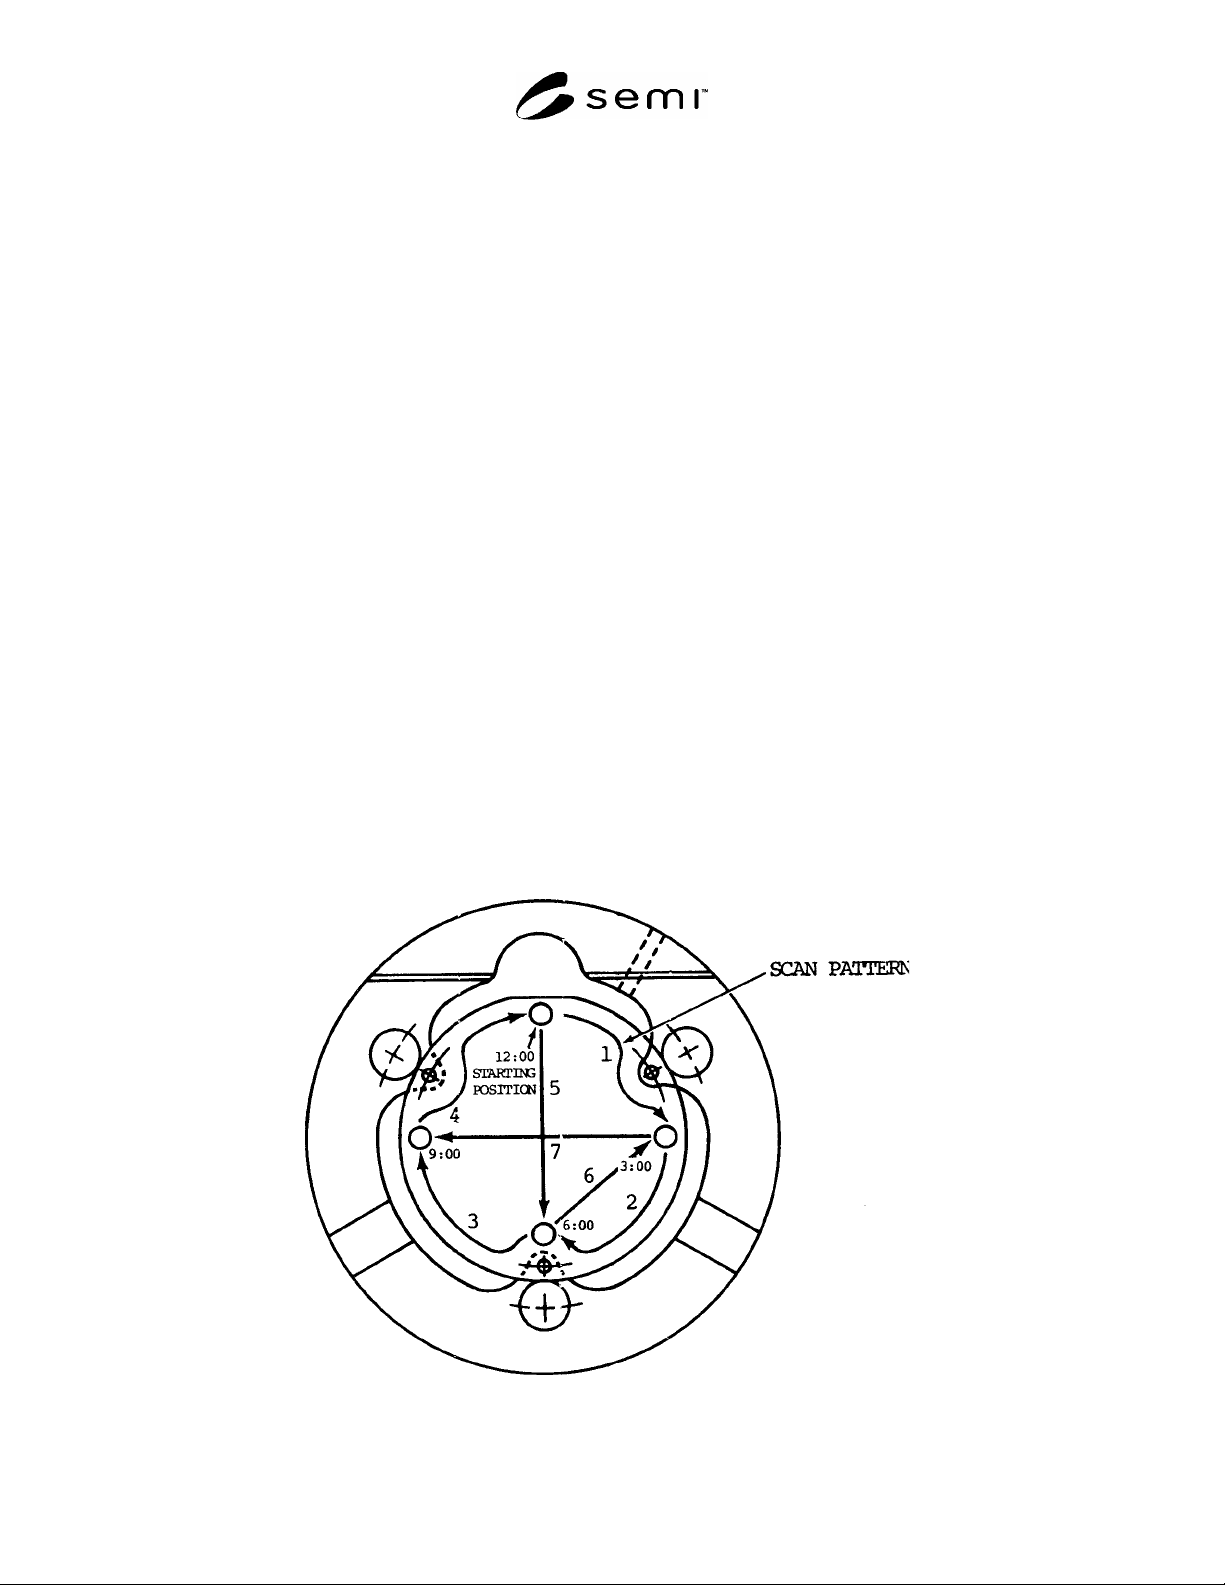
pattern shown in Figure 4. Remove the flat.
9.2.3 Inspect the recorded distance values and
calculate the difference between the maximum and
minimum value.
9.2.4 If the difference calculated in ¶9.2.3 is less than
or equal to 1.5 m (or 60 in.), accept the apparatus as satisfying the parallelism requirement.
NOTE 7: The value 1.5 m (or 60 in.) represents the total system transfer error of the reference ring together with the surface
plate and is intentionally greater than the tolerance of 1.0 m (or 40 in.) given for the parallelism of the defined plane of the
reference ring and the bottom surface of the ring.
10 Procedure
10.1 If not already assembled, assemble the apparatus with the selected reference ring corresponding to the intended
specimen size on the surface plate and the matching guide in position to limit ring movement. Make sure that the
probes are in the parking position and that the position is away from the operator (see Figure 2).
10.2 Place the test specimen on the support pads with the primary flat parallel with the flat orientation line and with
the periphery of the test specimen against the two guide pins closest to the probe parking position.
10.3 Move the ring on the surface plate until the probes are at the starting position of the scan.
10.4 Reset the indicator.
10.5 Move the reference ring on the surface plate to scan the probes along the curved and straight segments 1
through 7 (see Figure 4).
10.6 Record, in inches or micrometres, the individual displacements of the top and bottom surfaces at selected
points along the scan pattern or, for direct-reading instruments, the difference between the largest and smallest of the
differences or sums of the paired displacements, depending on whether warp (differences) or TTV (sums) is being
measured.
10.7 For referee measurements only, repeat ¶¶10.4 through 10.7 nine more times.
10.8 Position the ring so that the probes are in the parking position and remove the specimen.
10.9 Repeat ¶¶10.2 through 10.8 for each wafer to be measured.
11 Calculations
11.1 Unless the instrument is direct reading, calculate for each wafer the difference between each pair of
displacement values a and b and inspect the differences to identify the maximum and minimum difference values.
Calculate the warp or TTV in micrometers or inches according to the appropriate relation:
minmax
)()(
2
1
warp abab (1)
= Thickness of Master
Fi
g
ure 3
Thickness Gauge Linearity Check
SEMI MF657-0705 © SEMI 2003, 2005 7
minmax
)()(TTV abab
(2)
where:
a =
distance between the top surface of the wafer under test and the upper probe, in. (or m),
b =
distance between the bottom surface of the wafer under test and the lower probe, in. (or m),
max denotes the largest value of the difference or sum, and
min denotes the smallest value of the difference or sum.
11.2 For routine measurements, record the calculated value(s) of warp or TTV or both.
11.3 For referee measurements:
11.3.1 Calculate each measured warp or TTV from Equation 1 or Equation 2, respectively.
11.3.2 Then calculate the mean value and standard deviation.
11.3.3 Record the mean value as the warp or TTV, as appropriate.
12 Report
12.1 Report the following information:
12.1.1 Date of test,
12.1.2 Location of test,
12.1.3 Identification of operator,
12.1.4 Identification of measuring instrument(s),
12.1.5 Lot identification, including nominal diameter and thickness,
12.1.6 Description of sampling plan, and
12.1.7 Warp or TTV (or both) of each wafer measured, m or (in.)
Figure 4
Measurement Scan Pattern