semi合集-English.pdf - 第4012页
SEMI F48-0600 © SEMI 2000 7 larger componen t a nd delivered to th e laboratory), operator an d laboratory performing the test , type of material (e.g., PFA pellets, injection molded PVDF valv e, perfluoroelastom er O -r…

SEMI F48-0600 © SEMI 2000 6
11.3.8 Set the parameters of the digestion device to
manufacturer’s recommendations.
NOTE 10: If the pressure exceeds the pressure limits of the
vessel, the pressure will be reduced by the relief mechanism
of the vessel.
NOTE 11: Pressure control for a specific matrix is applicable
if instrument conditions are established using temperature
control. Because each matrix will have a different reaction
profile, performance using temperature control must be
developed for every specific matrix type prior to use of the
pressure control system.
11.3.9 At the end of the digestion program, allow the
vessels to cool for an appropriate period of time before
removing them from the system. When the vessels
have cooled to near room temperature, determine if the
microwave vessels have maintained a seal throughout
the digestion. Due to the wide variability of vessel
designs, a single procedure is not appropriate. The use
of a spiked control sample is appropriate to ensure that
analyte loss has not occurred due to vessel venting. For
vessels with burst disks, a careful visual inspection of
the disk may identify compromised sample digestions.
11.3.10 Complete the preparation of the sample by
carefully uncapping and venting each vessel in a fume
hood. Vent the vessels using the procedure
recommended by the vessel manufacturer. Transfer the
sample to an appropriate acid cleaned container.
11.3.11 If the digested sample contains particulates,
which may clog nebulizers or interfere with injection of
the sample into the instrument, the sample may be
centrifuged, allowed to settle, or filtered.
11.3.11.1 If necessary, centrifugation at 2,000–3,000
rpm for 10 minutes is usually sufficient to clear the
supernatant.
11.3.11.2 Settling –– If undissolved material remains
such as TiO, or other refractory oxides, allow the
sample to stand until the supernatant is clear. Allowing
a sample to stand overnight will usually accomplish
this.
11.3.11.3 Filtering –– If necessary, the filtering
apparatus must be thoroughly cleaned and pre-rinsed
with dilute (approximately 10% V/V) nitric acid. Filter
the sample through qualitative filter paper into a second
acid-cleaned container.
11.3.12 Continue preparing the sample as described in
Section 11.4.
11.4 Preparation of the Sample for Analysis
11.4.1 If the sample was obtained from the DDA
method, add 0.5 mL concentrated nitric acid to each
crucible.
11.4.2 For samples obtained from the DCV method,
transfer or decant the sample into volumetric ware.
11.4.3 Dilute either obtained sample to a required
volume with ultrapure water (usually 20 mL).
Alternatively, a gravimetric dilution of the samples is
also appropriate. The samples are now ready for
analysis. See Related Documents, Section 16 for
applicable trace inorganics test methods.
12 Recovery Preparation and Percentage
Recovery Rate Determination
12.1 Metal recovery percentage must be determined
for all instruments by the individual laboratory. This is
accomplished via spiking a crucible or digestion vessel
containing a polymer sample with a known
concentration of metals. Then, determining the
percentage of each metal recovered after the
decomposition process or acid digestion. The following
provides the recommended method for spiking:
12.1.1 Add a known volume of a standard to a crucible
or digestion container containing a polymer sample.
12.1.2 For DDA –– Gently evaporate the standard
solution to dryness.
12.1.3 Digest the dried standard and dried polymer
using the same procedure as for the samples. Typical
recovery rates are 70–110% for the alkali, alkaline
earths, and most transition metals.
13 Data Analysis
13.1 Calculations
13.1.1 The concentration of trace metals in the
solution must be calculated to determine the
concentration in µg/g (ppm) of the polymeric material
using the following equation:
polymer concentration (µg/g ) =
= solution concentration
(µg/L) × solution volume (L) / mass of the polymer(g)
13.1.2 Since the procedural blank does not contain a
weighed sample, the results must be transformed to
solid concentrations (in µg/g) by using the average
weight of the samples (see Section 11.1.2 and
corresponding NOTE).
14 Data Presentation
NOTE 12: Use the Report Form provided in Section 17 of this
document.
14.1 Sample Information
14.1.1 Provide the date(s) of the test, the person and/or
company requesting the analysis, the method in which
the sample was obtained (e.g., if it was separated from a

SEMI F48-0600 © SEMI 20007
larger component and delivered to the laboratory),
operator and laboratory performing the test, type of
material (e.g., PFA pellets, injection molded PVDF
valve, perfluoroelastomer O-ring), material supplier,
material model and lot number(s), date sample was
obtained and if the sample is a prototype or production
material.
14.2 Methods
14.2.1 Provide the method of cleaning the sample as
well as indicating if the sample arrived pre-cleaned
from the requester or if it was cleaned in the laboratory
performing the test.
14.2.2 Check the applicable box for the type of
digestion. Complete as well the information regarding
the conditions.
14.3 Results
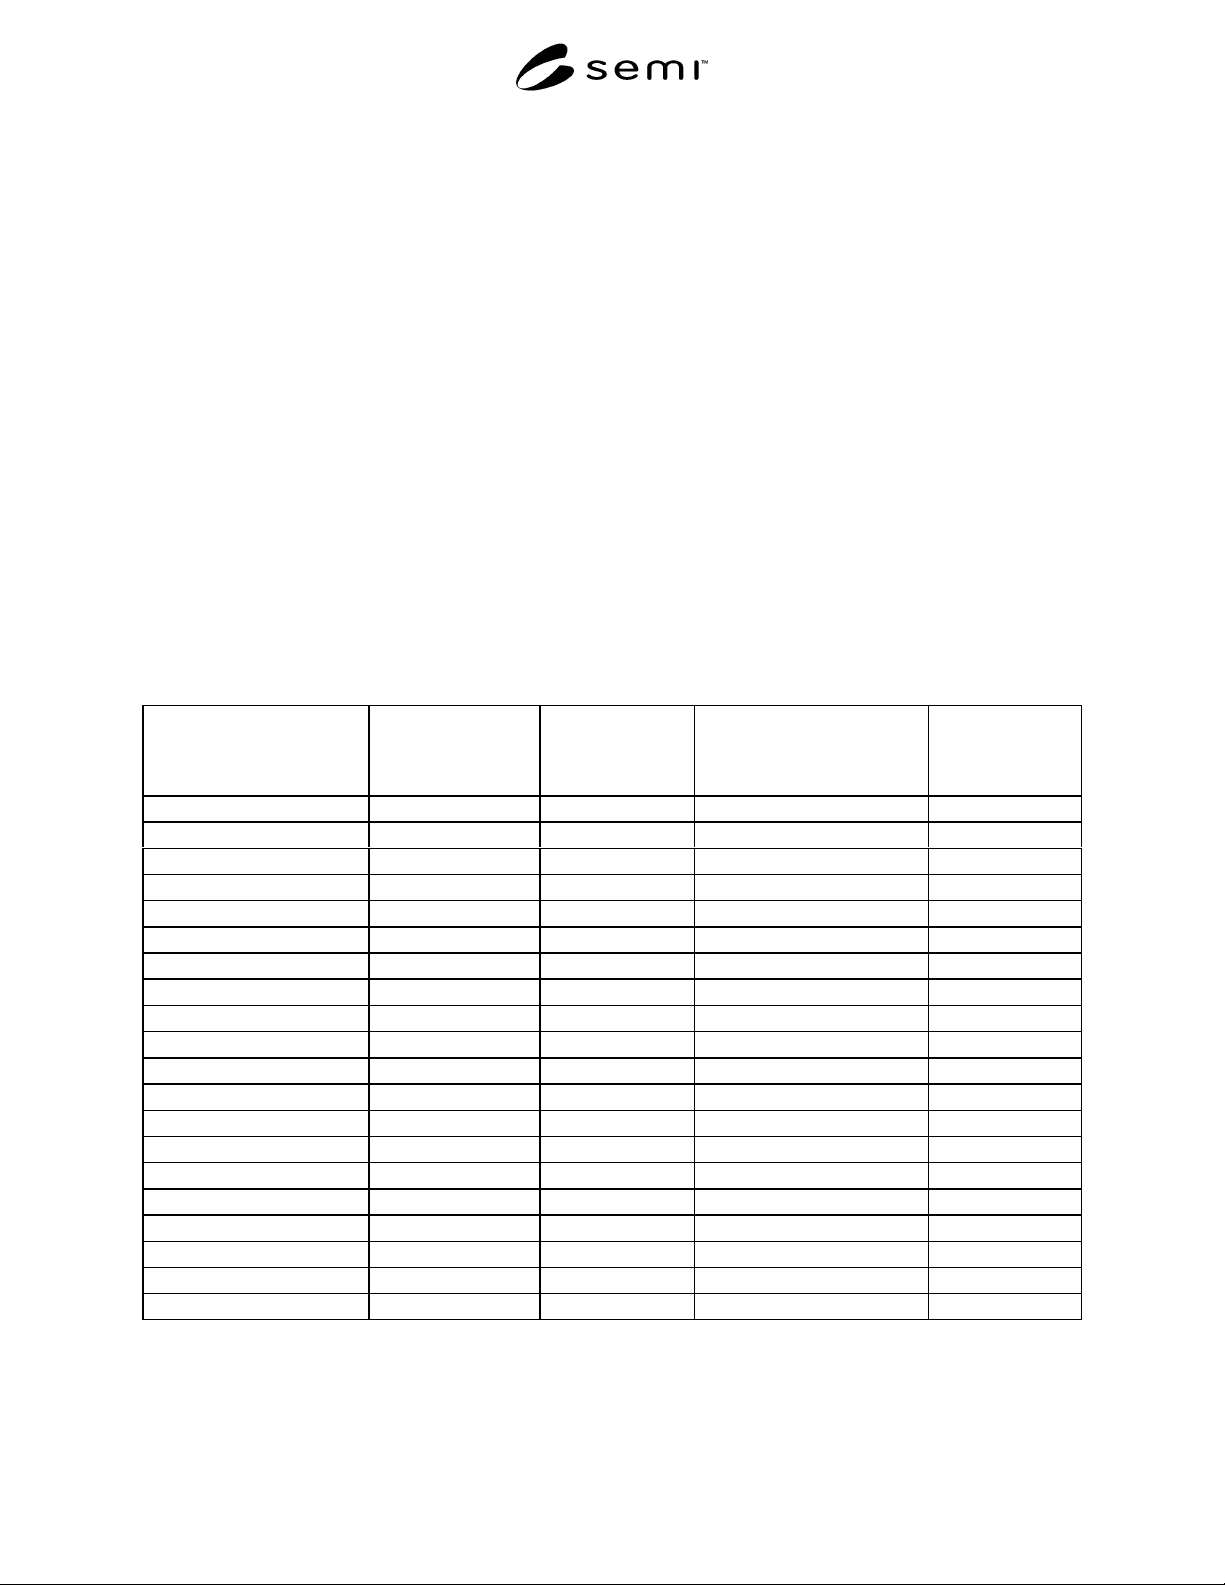
14.3.1 Use Table 1, Trace Metals in Bulk Polymer
Worksheet in Section 17.3 to report the results of the
analysis along with detection limits and recovery rates
for all elements required in the samples.
NOTE 13: For this document, the detection limit is defined as
the concentration equivalent to three standard deviations of
the results of the procedural blanks (see Section 13.1.2).
NOTE 14: The procedural blanks should be averaged and
then subtracted from each sample (see Columns 3 and 4 of
Table 1).
NOTE 15: If multiple samples of the same polymer material
are evaluated, an average and standard deviation must be
reported.
15 Precision and Bias
15.1 Expected variations in the blank are due to
environmental and instrument variation.
15.2 Expected variation in the samples is 20–30% and
is due to environmental, instrumental, and ashing or
digestion variations.
15.3 This test does not give an indication of the
variations found in the polymer sample material.
15.3.1 Analyze multiple samples of the same polymer
material to determine the variation.
15.3.2 Refer to ASTM D4375 for information
regarding sample populations to determine differences
between materials.
16 Related Documents
16.1 References Pertaining to ICP–MS
Dams, R. F. J., Goossens, J., Moens, L. “Spectral and
Non-Spectral Interferences in Inductively Coupled
Plasma Mass Spectrometry” Microchim. Acta 119
(1995):277-286.
Evans, E. H., Giglio, J. J., “Interferences in Inductively
Coupled Plasma Mass Spectrometry” J Anal. Atom.
Spectrom. 8 (1993):1-18.
Jarvis, K. E., Gray, A. L., Houk, R. S. “Handbook of
Inductively Coupled Plasma mass Spectrometry”
Blackie, Glasgow 1992 (USA: Chapman and Hall, New
York).
Shao, Y. and G. Horlick. “Recognition of Mass Spectral
Interferences in Inductively Coupled Plasma–Mass
Spectrometry.” Applied Spectroscopy 45 (1991):143.
16.2 References Pertaining to ICP–AES
Garbarino, J.R., B.E. Jones, G.P. Stein, W.T. Belser,
and H.E. Taylor. “Statistical Evaluation of an ICP–AES
Method for Routine Water Quality Testing.” Applied
Spectroscopy 39 (1985):535.
Winge, R.K., V.S.Fassel, R.N. Kniseley, E. De Kalb,
and W.J. Haas Jr. “ICP as an Analytical Source.”
Spectrochimica Acta 32B (1977):327
16.3 References Pertaining to Microwave Digestion
Kingston, H. M. Skip and Haswell, Steve, Eds.,
Microwave Enhanced Chemistry: Fundamentals,
Sample Preparation, and Applications, ACS
Professional Reference Book Series, American
Chemical Society, Washington, DC, 1997.
16.4 U.S. EPA Documents
3
U.S. EPA Method 3052 –– Microwave Assisted Acid
Digestion of Siliceous and Organically Based Matrices
U.S. EPA RCRA SW-846 –– Chapter 3, sections on
clean chemistry and microwave decomposition.
16.5 SEMATECH Documents
4
SEMASPEC #92010956B–STD –– SEMATECH
Provisional Test Method for Analyzing the Plastic
Surface Composition and Chemical Bonding of
Components of UPW Distribution Systems (ESCA
Method)
SEMASPEC #92010936B–STD –– SEMATECH
Provisional Test Method for the Determination of
Leachable Trace Inorganics from UPW Distribution
System Components
3 Environmental Protection Agency, 401 M St., SW, Washington, DC
20460, USA
4 SEMATECH, 2706 Montopolis Dr., Austin TX 78741
SEMI F48-0600 © SEMI 2000 8
17 Report Form
17.1 Sample Information Test Date(s): ________________
17.1.1 Person/Company Requesting Analysis: ________________________________________
17.1.2 Method of Obtaining Sample: _______________________________________________
17.1.3 Operator and Laboratory Performing Test: _____________________________________
17.1.4 Sample Material: ________________ Sample Supplier: ___________________
17.1.5 Model/Lot Number: _________________ Date of Sample: ____________________
17.1.6 Circle one: Pre-Production Material or Final Production Material
17.2 Methods
17.2.1 Sample Cleaning Technique (SEMI F40 or other): _______________________________
17.2.2 Digestion Technique (check one)
Dry Ashing Closed Vessel
Type of Crucible: _______ Vessel Material: _____________
Temperature of Ashing: _____°C Reaction Conditions: _______________________
Time of Ashing: _________ hours _______________________________
17.3 Results
Table 1 Trace Metals in Bulk Polymer Worksheet
Element Detection Limit
(µ
g/g)
Procedural Blank
(µ
g/g)
Result with Blank
Subtraction
(µ
g/g)
% Recovery
Aluminum
Barium
Calcium
Chromium
Cobalt
Copper
Iron
Lead
Lithium
Molybdenum
Magnesium
Manganese
Nickel
Potassium
Sodium
Strontium
Tin
Titanium
Zinc
Zirconium