semi合集-English.pdf - 第7254页
SEMI MF525-0705 © SEMI 2003, 2005 17 RELATED INFORMATION 3 SOURCES OF SYSTEMATIC ERROR NOTICE : This related information is not an official part of SEMI MF525. It w as derived fro m information developed d uring the ori …
SEMI MF525-0705 © SEMI 2003, 2005 16
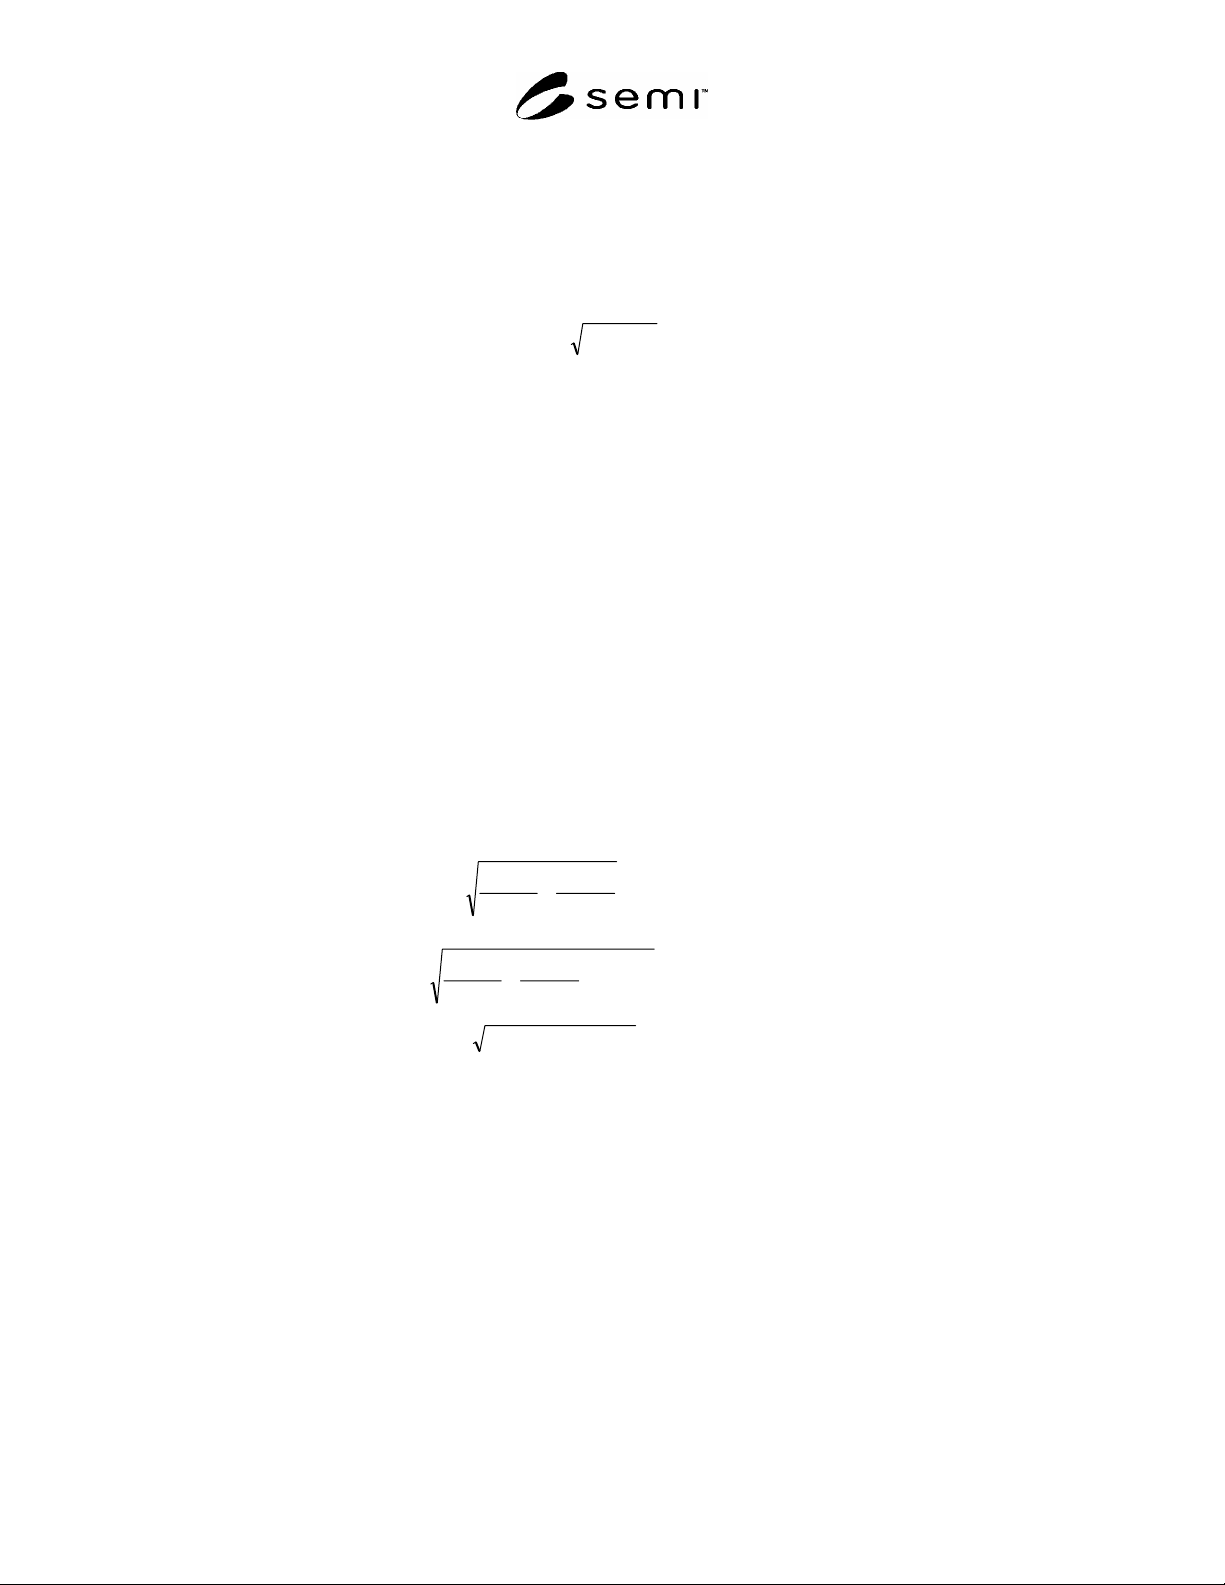
R2-3 Propagation of Random Error and Uncertainty of Resistivity Values When Determining Test Specimen
Resistivity by Calibrated Spreading Resistance Measurements
R2-3.1 If the entire calibration procedure (or just a part containing specimens of a limited range of resistivity values
of interest) is performed once for each test specimen measured, the random errors for the measurement of both test
and calibration specimens are statistically independent and can be added in root-mean-square fashion to estimate the
total random error uncertainty, s
T
, in the derived resistivity value of a test specimen:
22
ctT
s
(R2-3)
R2-3.1.1 The associated 95% confidence interval for resistivity values derived from spreading resistance
measurements, considering only random sources of error, is given by S
T
= 1.96 s
T
, or approximately by 2s
T
.
R2-3.2 If the calibration procedure is performed once, and a number of test specimens are then measured before
calibration is performed again, the random errors are not independent and the errors cannot be combined in the
above fashion. In this case, the “random” errors on the calibration specimen act as short-term systematic errors: the
errors for some calibration specimens are on the high side, the errors for others are on the low side, and they will be
fixed until the next calibration. If this situation obtains, a reasonable estimate of the 95% confidence interval for
derived resistivity values, due to what are normally random errors, is given by:
ctT
S
2 (R2-4)
where
t
and
c
are obtained from Equations R2-1 and R2-2.
R2-4 Examples of Use of Propagation of Error Equations to Estimate the 95% Confidence Limits (Due to Random
Error Only) for the Resistivity Values of a Test Specimen
R2-4.1 Assumptions — One preparation each of test specimens and of calibration specimens (n
p
= m
p
= 1); ten
measurements are taken and averaged on the calibration specimens closest in resistivity to the test specimen (m
r
=
10; five measurements are taken and averaged on the test specimen (n
r
= 5); the test specimen has a resistivity of
approximately 1 ·cm: s = 0.7%; diamond bevel polishing is used (
r
= 6.3%,
R
= 6.2%).
R2-4.2 Case I — Calibration measurements are always taken prior to measurement of each test specimen.
%88.60688.0
51
062.0
1
063.0
22
t
%64.60664.0007.0
101
062.0
1
063.0
2
22
c
%1.19191.00664.00688.02
22
T
S
R2-4.3 Case II — Calibration measurements are not taken prior to each test specimen measurement.
%0.27270.00664.00688.02
T
S
R2-5 Equations R2-1 through R2-4 may also be used to estimate the random error in the measurement process
based only on measurements in a single laboratory. In this case the values of
r
and
R
to be used must be
determined through appropriate replicate experiments using the desired measurement conditions in that laboratory.

SEMI MF525-0705 © SEMI 2003, 2005 17
RELATED INFORMATION 3
SOURCES OF SYSTEMATIC ERROR
NOTICE: This related information is not an official part of SEMI MF525. It was derived from information
developed during the original preparation of the standard in ASTM Committee F-1 on Electronics in 1977. This
related information was approved for publication by full letter ballot procedures.
R3-1 In addition to random errors, there are a number of sources of systematic error which can be identified but
which cannot be estimated here; their estimation must be done by the individual laboratory.
R3-2 Calibration Specimen Nonuniformity — The four-point probe method for measuring the resistivity of the
calibration specimens responds to the average resistivity of a specimen over an area which is several times the total
spacing of the four-point probe. Within this area there may be significant variation of resistivity. Spreading
resistance measurements respond to the local resistivity of the calibration specimens. Calibration specimens shall
therefore have uniform resistivity such that the resistivity assigned to the specimen by use of the four-point probe
method satisfactorily represents the resistivity value at the location where spreading resistance calibration
measurements will be taken; otherwise systematic errors are incurred in calibration.
R3-3 Choosing a Model for the Calibration Relation — The empirical relation between spreading resistance and
resistivity values of the calibration specimens are commonly approximated by a number of different relations:
single-piece log-log least-squares fit, piecewise log-log fit, and polynomial fit. The best form or model to fit the
calibration data has not been established. Any of the chosen models may have significant high-side or low-side
systematic errors at various resistivity values compared to the unknown “true” relation.
R3-4 Loss of Control of the Spreading-Resistance Probes — Wear, contamination, or other degradation of the
probes may cause sudden shifts in measurement response at some or all resistivity values. Such shifts may not be
accompanied by recognizable loss of measurement precision and merely add an additional systematic error between
calibration and test specimen measurement values.
R3-5 Loss of Control of Specimen Preparation Process — Contamination of specimen-polishing materials or post-
polishing chemicals as well as excess polishing-induced damage or unrecognized differences in technique such as
applied pressure, specimen area, or post-polishing storage environment may cause undetected systematic errors in
test or calibration specimen values.
NOTICE: SEMI makes no warranties or representations as to the suitability of the standards set forth herein for any
particular application. The determination of the suitability of the standard is solely the responsibility of the user.
Users are cautioned to refer to manufacturer's instructions, product labels, product data sheets, and other relevant
literature, respecting any materials or equipment mentioned herein. These standards are subject to change without
notice.
By publication of this standard, Semiconductor Equipment and Materials International (SEMI) takes no position
respecting the validity of any patent rights or copyrights asserted in connection with any items mentioned in this
standard. Users of this standard are expressly advised that determination of any such patent rights or copyrights, and
the risk of infringement of such rights are entirely their own responsibility.
Copyright by SEMI® (Semiconductor Equipment and Materials
International), 3081 Zanker Road, San Jose, CA 95134. Reproduction of
the contents in whole or in part is forbidden without express written
consent of SEMI.

SEMI MF657-0705 © SEMI 2003, 2005 1
SEMI MF657-0705
TEST METHOD FOR MEASURING WARP AND TOTAL THICKNESS
VARIATION ON SILICON WAFERS BY NONCONTACT SCANNING
This test method was technically approved by the global Silicon Wafer Committee. This edition was
approved for publication by the global Audits and Reviews Subcommittee on April 6, 2005. It was available
at www.semi.org in June 2005 and on CD-ROM in July 2005. Original edition published by ASTM
International as ASTM F 657-80. Last previous edition SEMI MF657-92 (Reapproved 1999).
1 Purpose
1.1 Warp and thickness variation of silicon wafers can significantly affect the yield of semiconductor device
processing.
1.2 Knowledge of these characteristics can help the supplier and customer determine if the dimensional
characteristics of a particular wafer satisfy given geometrical requirements.
1.3 Changes in wafer warp during processing can adversely affect subsequent handling and processing steps
1.4 This test method is suitable for measuring the warp and TTV of silicon wafers used in semiconductor device
processing in the as-sliced, lapped, or polished condition and for monitoring thermal and mechanical effects on the
warp of silicon wafers during device processing.
2 Scope
2.1 This test method covers a noncontacting, nondestructive procedure to determine the warp and total thickness
variation (TTV) of clean, dry silicon wafers in a free (unclamped) condition. The procedure uses a three-point back
surface reference plane for determining warp.
2.2 The test method is applicable to circular silicon wafers from 50 mm (or 2.0 in.) to 200 mm in diameter, and
100 m (or 0.004 in. approximately) and larger in thickness, independent of thickness variation and surface finish.
The test method is applicable to wafers of semiconductors other than silicon with these same physical
characteristics.
2.3 This test method is not intended to measure surface flatness; warp, which is not to be confused with flatness, is
a bulk property of the wafer. Warp may be caused by unequal stresses on the two exposed surfaces of the wafer. It
cannot be determined from measurements on a single exposed surface. The median surface may contain regions
with upward or downward curvature or both; under some conditions the median surface may be flat.
2.4 This test method measures warp and TTV of a wafer with no mechanical force except gravity applied during the
test. Therefore, the procedure described gives the unconstrained value of warp or TTV. Gravity-induced deflection
alters the shape of the wafer and is included in the measurement.
2.5 For application to wafers of diameter 3 in. or smaller, the values stated in inch-pound units are to be regarded as
the standard whether or not they appear in parentheses; the values stated in acceptable metric units are for
information only. For application to wafers of diameter larger than 3 in., the values stated in acceptable metric units
are to be regarded as the standard; the values stated in inch-pound units are for information only.
NOTICE: This standard does not purport to address safety issues, if any, associated with its use. It is the
responsibility of the users of this standard to establish appropriate safety and health practices and determine the
applicability of regulatory or other limitations prior to use.
3 Limitations
3.1 In this test method, both TTV and warp are determined using a specified partial scan pattern; thus, the entire
surface is not sampled and use of another scan pattern may not yield the same result.
3.2 Most equipment systems capable of this measurement have a definite range of wafer thickness combined with
warp which can be accommodated without readjustment. Any values observed while in an over-range condition are
invalid.