semi合集-English.pdf - 第4614页
SEMI D41-0305 © SEMI 2005 5 Figure 4 The Graph Information for the Darker Mura Patterns Figure 5 The Graph Information for th e Brighter Mur a Patterns Table 2 The Test Result for th e Darker Mura Patterns Table 3 The Te…
SEMI D41-0305 © SEMI 2005 4
7.2.5 Measuring Distance for Semu Measurement
7.2.5.1 Because we use a CCD Camera, the measuring distance is set by the same angle in all DUT. We standardize
the 15 display size and testing distance is 500 mm. But the testing distance should be different from each display
size.
7.2.5.2 In case of the 15 display, the angle from the center to the edge position can be calculated below.
)4.(..........
_
5.0_
tan
distanceMeasuring
distancediagonal
Therefore the reference angle is about 20.856° and then it can be calculated the measuring distance of all DUT.
)5...(
tan
5.0_
_
distancediagonal
distanceMeasuring
Table 1 Examples of Measuring Distance
Display Size
(in.)
14.1 15 17 18.1 20.1
Measuring Distance
(mm)
470 mm 500 mm 566 mm 603 mm 670 mm
#1 This measuring distance can have the same measuring angle in each different size sample.
7.2.6 Determination of the Threshold for the Mura Area
7.2.6.1 It is very important to calculate the Semu value. If some threshold values are different from each test
equipment, the Semu test results are different. Therefore we use the Cx value to determine the threshold value. In
this standard, when the Cx value is over 1.01, we can consider the Mura area.
7.2.7 Area Calculation Method
7.2.7.1 There are two main parameters for calculating the Semu value. The first one is the Cx value and the other is
the Sx value. The Sx value means that the surface area of Mura being measured. We can calculate the size of Mura
area with counting the number of pixels under the CCD equipment test.
7.2.8 Test Sample Pattern for the Sample Test
7.2.8.1 Originally, the test pattern should be set by 50 cd/m
2
in the white pattern. And the permissible error is 10
cd/m
2
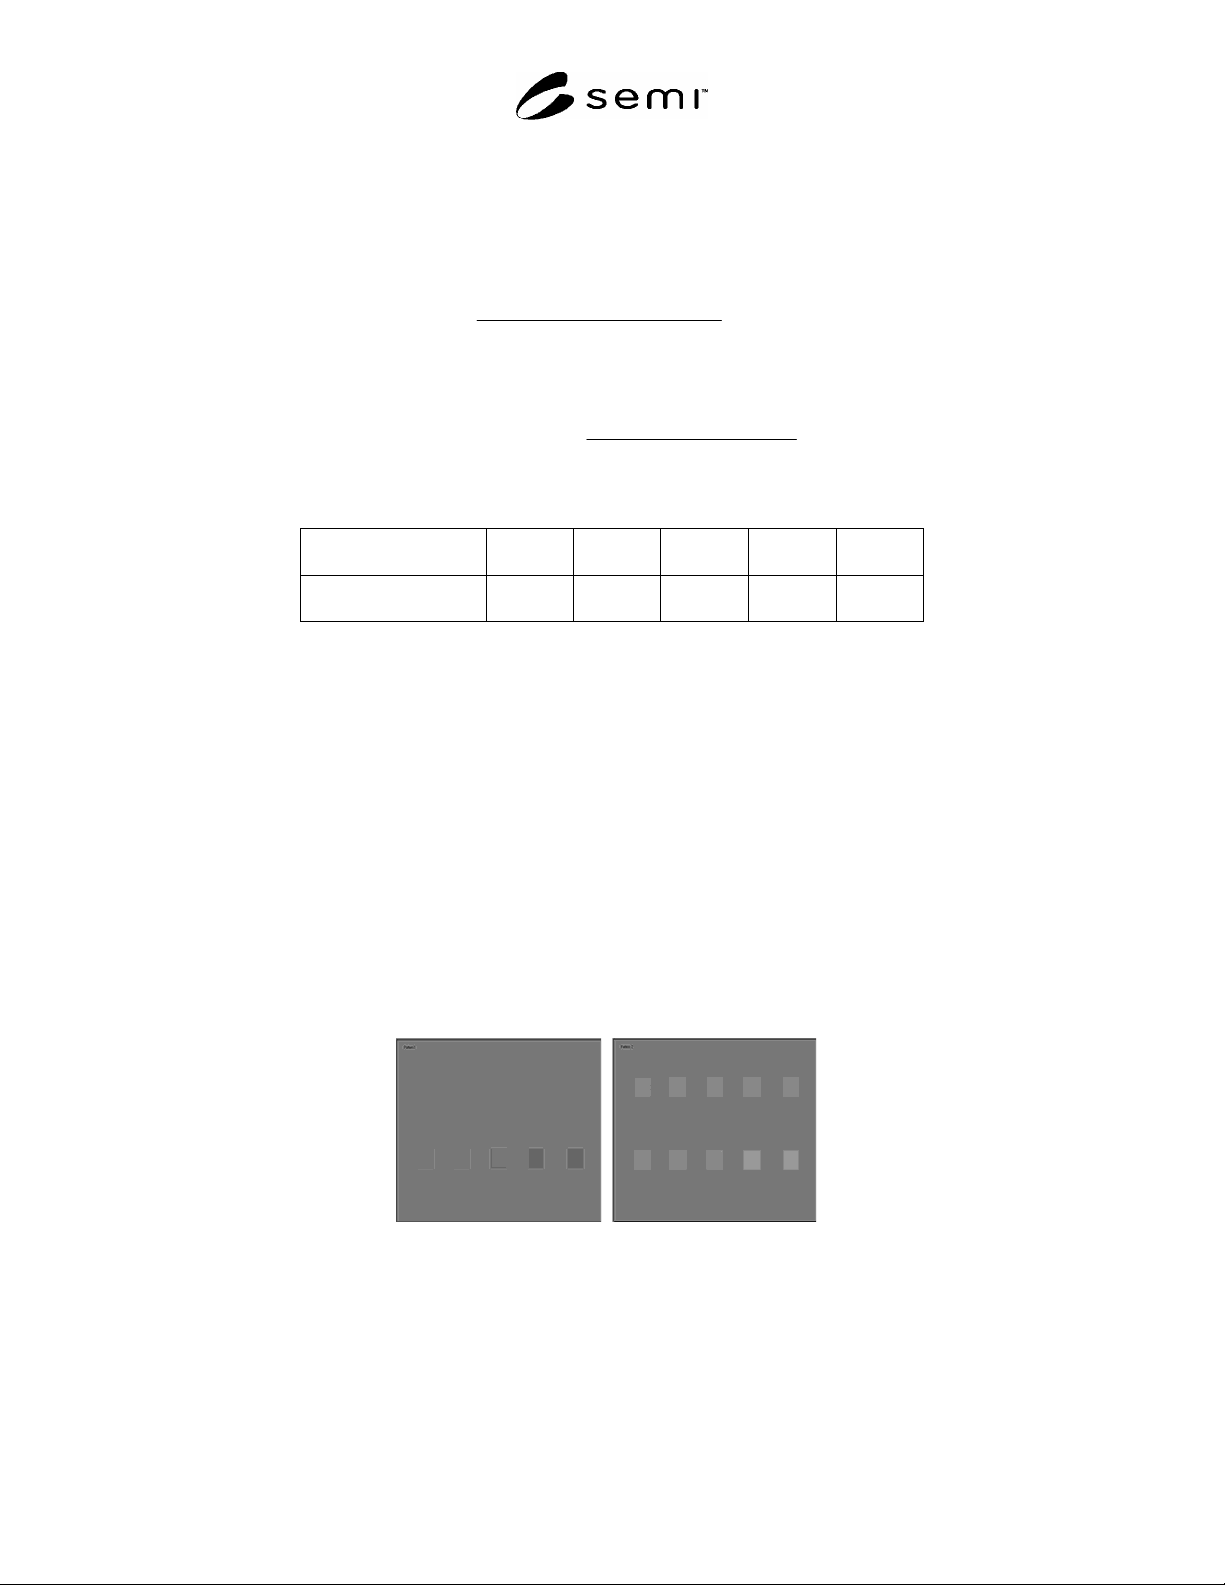
. But we use some artificial Mura test patterns for checking the sensitivity of the Semu parameter. The test
pattern has 10 Muras in Figure 3. Each Mura has a different gray level. In Figure 3, the left one shows darker Mura
patterns, and the right one shows brighter Mura patterns.
Figure 3
Test Patterns for Mura
7.2.9 Test Results for the Sample Patterns
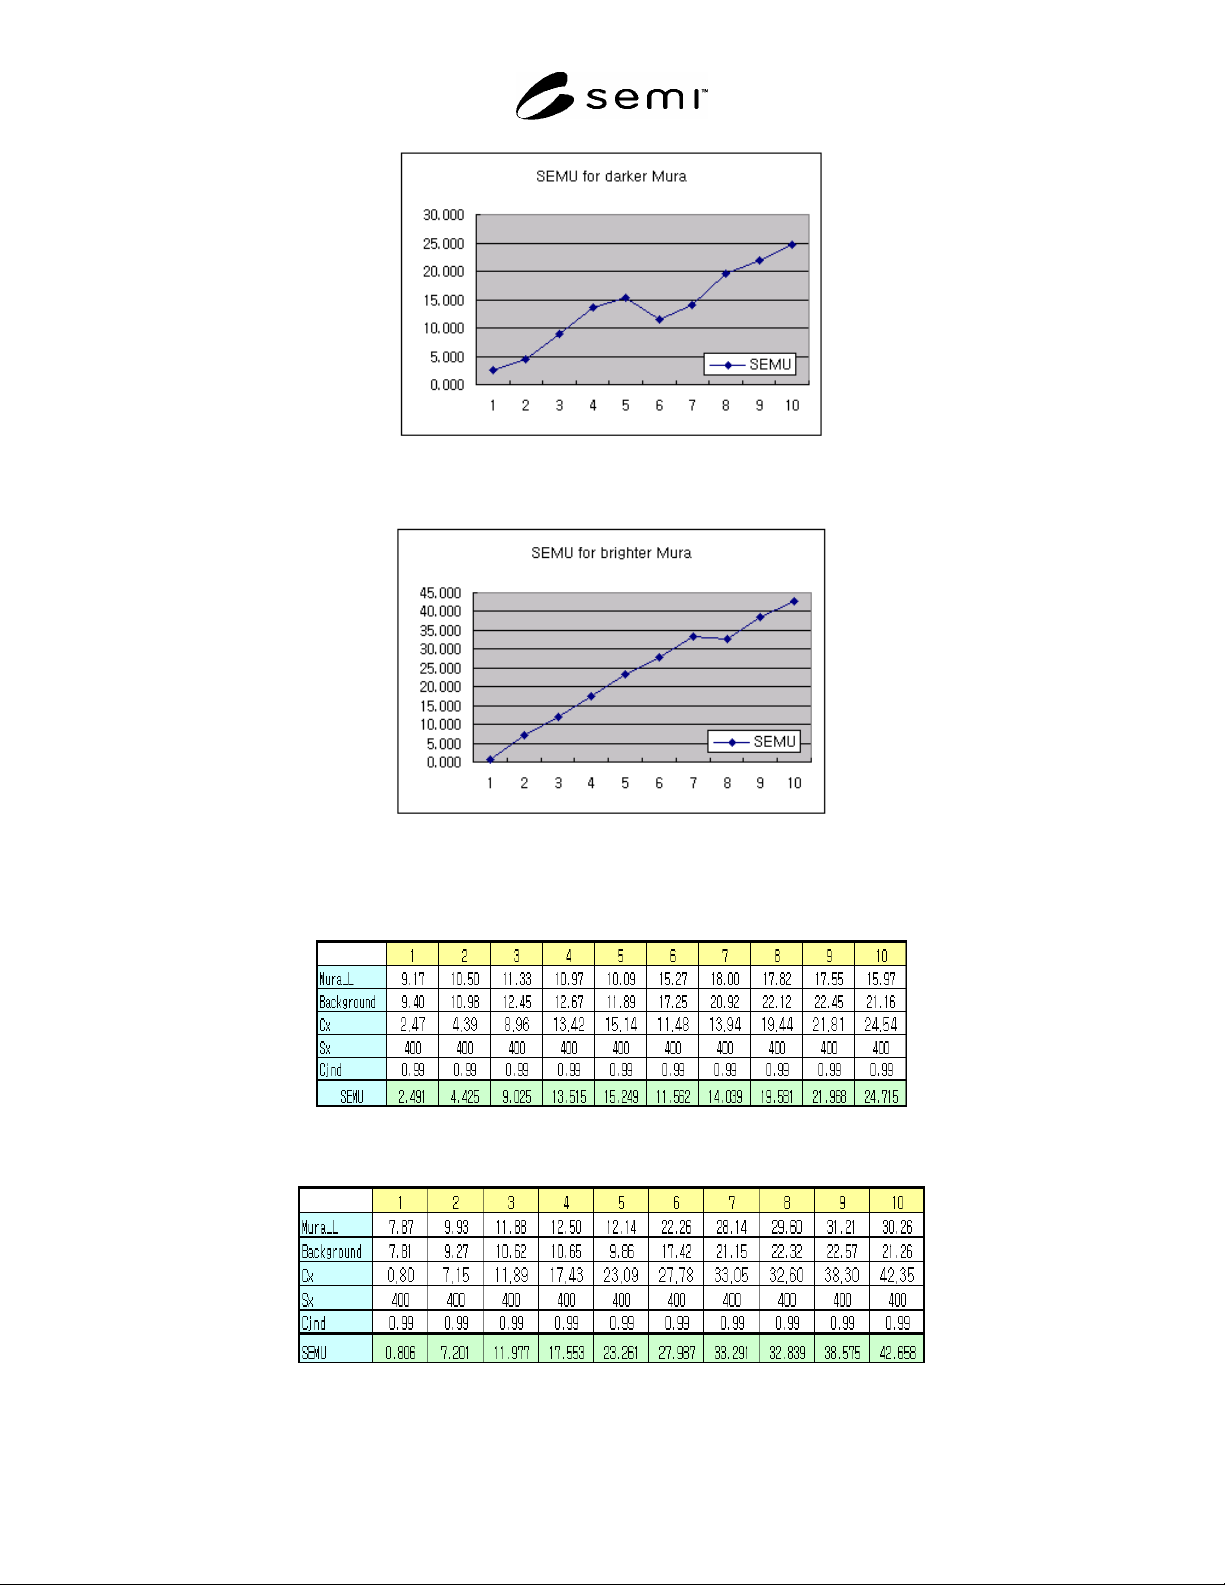
7.2.9.1 Table 2 shows that the actual results for the darker Mura test pattern and Table 3 is for the brighter Mura
pattern. Figure 4 is a graphic information result for the dark Mura and Figure 5 is a graphic information result for the
bright Mura.
SEMI D41-0305 © SEMI 2005 5
Figure 4
The Graph Information for the Darker Mura Patterns
Figure 5
The Graph Information for the Brighter Mura Patterns
Table 2 The Test Result for the Darker Mura Patterns
Table 3 The Test Result for the Brighter Mura Patterns

SEMI D41-0305 © SEMI 2005 6
NOTICE: SEMI makes no warranties or representations as to the suitability of the standards set forth herein for any
particular application. The determination of the suitability of the standard is solely the responsibility of the user.
Users are cautioned to refer to manufacturer's instructions, product labels, product data sheets, and other relevant
literature, respecting any materials or equipment mentioned herein. These standards are subject to change without
notice.
By publication of this standard, Semiconductor Equipment and Materials International (SEMI) takes no position
respecting the validity of any patent rights or copyrights asserted in connection with any items mentioned in this
standard. Users of this standard are expressly advised that determination of any such patent rights or copyrights, and
the risk of infringement of such rights are entirely their own responsibility.
Copyright by SEMI® (Semiconductor Equipment and Materials
International), 3081 Zanker Road, San Jose, CA 95134. Reproduction of
the contents in whole or in part is forbidden without express written
consent of SEMI.