semi合集-English.pdf - 第6500页
SEMI G80-0200 © SE MI 2000 8 of poten tiall y m a sked resu lts. The use of external instruments fac ilitates indep endent o bservation o f indiv id ual param eters, but requires physical movement of a probe (u nless aut…
SEMI G80-0200 © SEMI 20007
single test pattern burst. The following nested loop
outline describes the test flow:
for amplitude = 1V, 3V, 5V
for direction =
odd_pins_drive_&_even_pins_compare to
even_pins_drive_&_odd_pins_compare
execute single pattern with the following
dynamic changes:
Test
Cycle
Drive
Format
Format
Offset
Pulse
Width
Drive
Data
Compare
Offset
Expect
Data
min SBC 20% 33% 1 53% H
min SBC 20% 33% 1 86% L
min SBC 20% 33% 0 53% L
min SBC 20% 33% 0 86% H
min SBC 20% 33% 1 20% L
.
.
min SBC 20% 33% 0 20% H
64*min SBC 20% 33% 1 53% H
64*min SBC 20% 33% 1 86% L
64*min SBC 20% 33% 0 53% L
64*min SBC 20% 33% 0 86% H
64*min SBC 20% 33% 1 20% L
64*min SBC 20% 33% 0 20% H
2*min SBC 20% 33% 1 53% H
2*min SBC 20% 33% 1 86% L
2*min SBC 20% 33% 0 53% L
2*min SBC 20% 33% 0 86% H
2*min SBC 20% 33% 1 20% L
2*min SBC 20% 33% 0 20% H
63*min SBC 20% 33% 1 53% H
63*min SBC 20% 33% 1 86% L
63*min SBC 20% 33% 0 53% L
63*min SBC 20% 33% 0 86% H
63*min SBC 20% 33% 1 20% L
63*min SBC 20% 33% 0 20% H
.
.
32*min SBC 20% 33% 1 53% H
32*min SBC 20% 33% 1 86% L
32*min SBC 20% 33% 0 53% L
32*min SBC 20% 33% 0 86% H
32*min SBC 20% 33% 1 20% L
32*min SBC 20% 33% 0 20% H
detect earliest occurrence of format
transition midpoint with the latest
compare pin
detect latest occurrence of format transition
midpoint with the earliest compare pin
error = (latest occurrence - earliest occurrence)
end direction
end amplitude
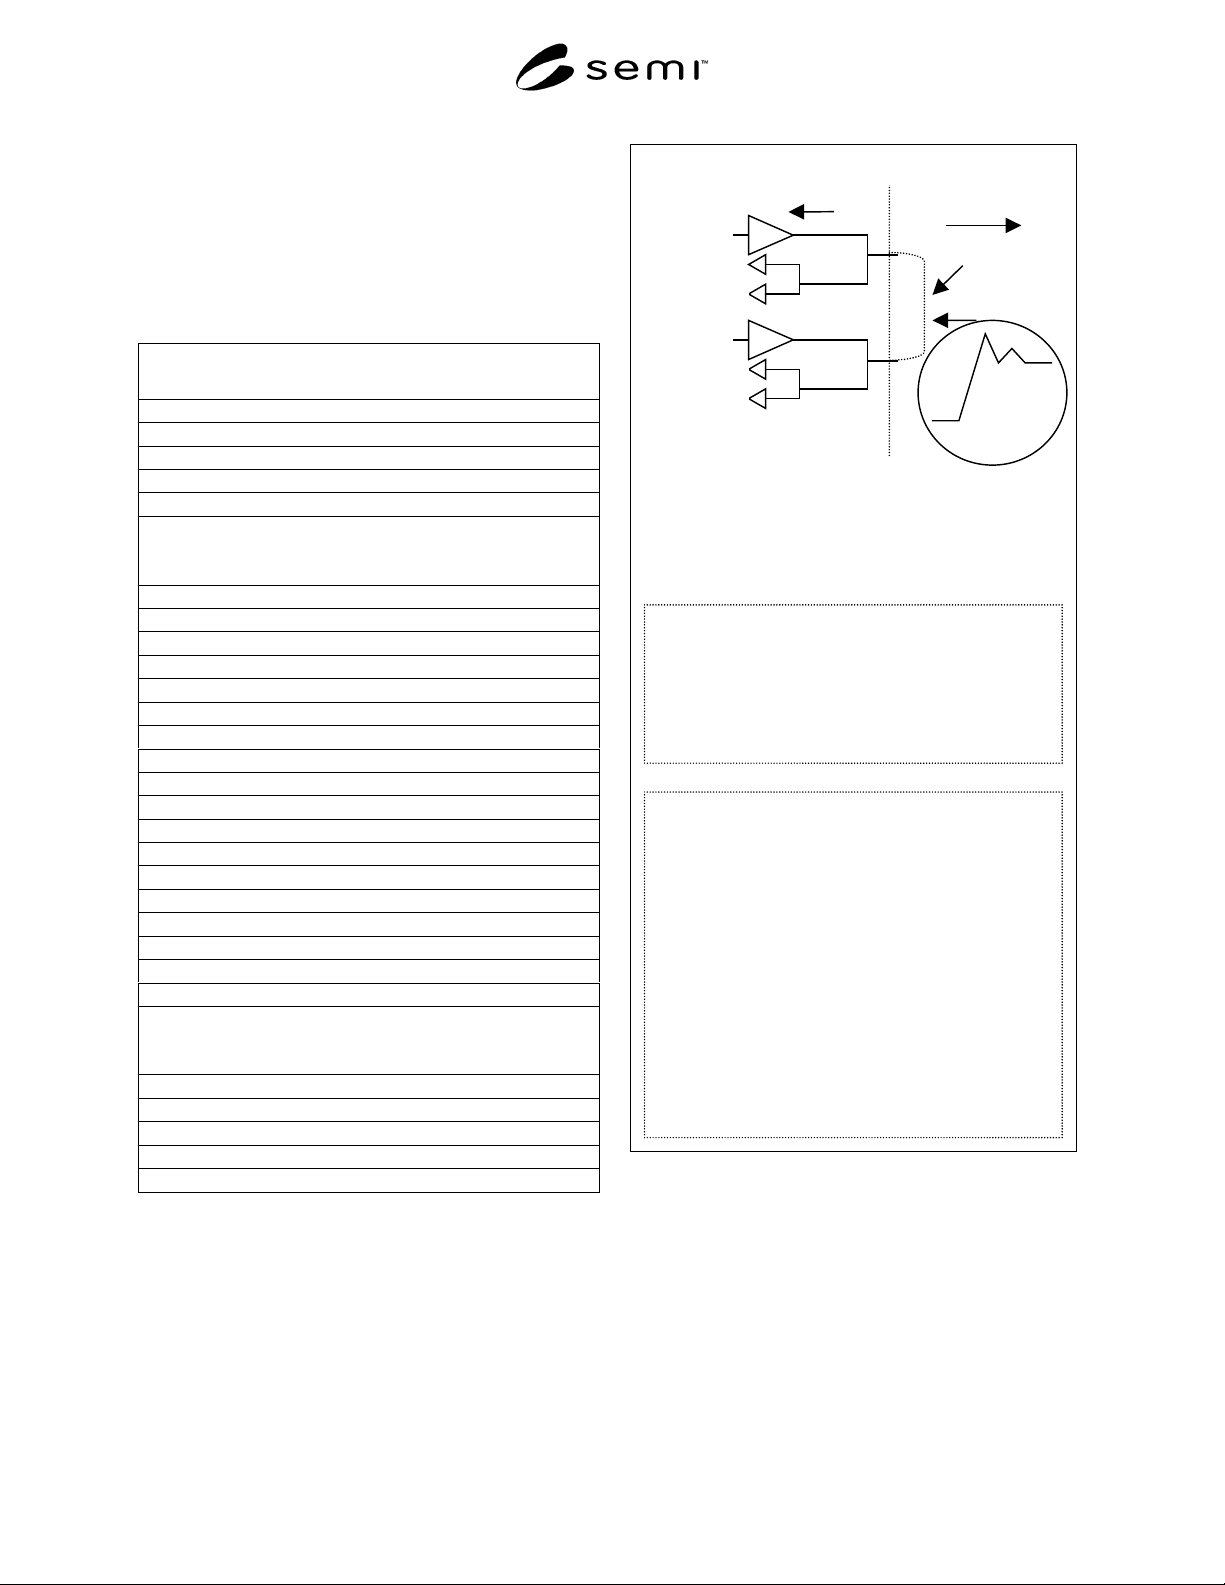
Pairs of adjacent tester pins can be shorted together
with a minimum length interconnect on the
performance board.
A reference for the oscilloscope measurement is
required. That reference can be any signal
synchronized to the test system's timing. The
reference signal chosen should be consistent and
stable. Examples of this may be another tester pin or
master oscillator reference signal.
Pin n
Driver
Receiver
Pin n+1
Driver
Receiver
N
OTE 1: The user of this method may find improved
driver signal attributes using an open circuit
performance board, versus the shorted board
indicated here for Level 2 Drive Input Timing Error
data collection. On the other hand the shorted
performance board, using the driver as the signal
source, is a viable approach for the Compare Output
Timing Error Test. Regardless, the user may
optionally choose to use a pulse generator as the
signal source for the Compare Output Timing Error
test. The 50-ohm pulse generator must have edge
speeds that are comparable to the driver it is
replacing. Test setup conditions and the pulse
generator rise time employed must be documented on
the exception page (Appendix 3).
Oscilloscope
Short (See
N
OTE 1.)
Tester
Performance
board
Figure 4
Level 2 Verification
10.4 Level 2 Tests — The efficiency of data collection
with Level 1 tests may preclude isolation of certain
specification components. The self-analysis procedures
may also mask some error terms that contribute to other
specification components. Therefore, Level 2 modules
are intended to supplement Level 1 results by using
external instruments to distinguish individual
specification components and provide detailed analysis

SEMI G80-0200 © SEMI 2000 8
of potentially masked results. The use of external
instruments facilitates independent observation of
individual parameters, but requires physical movement
of a probe (unless automated with robotics), which
results in less efficient data collection. Reference
Figure 4.
10.4.1 Drive Input Timing Error Test — Since the
driver input timing error cannot be distinguished from
compare output timing error with Level 1 tests
9
an
external instrument must be used to isolate the driver
input timing error from compare output timing error.
An external instrument is also required to identify pin
to pin “skew” beyond adjacent pins, since Level 1 only
uses adjacent pin pairs for analysis. This requires
independent measurements of representative driver
input timing conditions. The reference for
measurement of driver input timing error is a high
bandwidth-digital sampling oscilloscope. Exhaustive
testing of all pins is impractical, so a reduced set of
representative conditions is used. A non-binary pin
sampling increment is used to ensure that traditional
binary architectural boundaries are crossed. The
tolerance for the driver input timing error test is ±
20ps
10
due to the tester/instrument interaction using a
generic measurement method. The following nested
loop outline describes the test flow:
for amplitude = 3V
for pin = 1 to n by 3
for test_cycle = min, 2*min, 3*min, 10*min
for format_delay = 50% of test cycle
for format = NR, RTZ, RTO, SBC
for all format transitions
detect midpoint of drive transition with
oscilloscope (averaging = 8)
error = (measured_delay - pro-
grammed_format_edge_time -
zero_reference_measurement)
end transitions
end format
end format_delay
end test_cycle
end pin
end amplitude
10.4.2 Compare Output Timing Error Test — Since
the compare output timing error cannot be distinguished
from driver input timing error with Level 1 tests, an
external reference must be used to isolate compare
output timing error from driver input timing error. This
requires independent measurement of representative
9 See APPENDIX 2, Section A2-1.3 and Appendix 2, Examples for an
explanation.
10 When recording measurements, data log all measurements as they are taken
from the measurement equipment and show the associated equipment tolerance
as a separate entity.
compare timing conditions. Each tester driver is used
to provide a synchronous reference signal by shorting
adjacent tester channels together on a performance
board with minimum, equal length interconnections.
The actual delay of the driver signal is verified with a
high bandwidth-digital sampling oscilloscope. (See
Figure 4.)
NOTE 2: If a signal reflection is present at the midpoint of the
observed signal (due to a long distance from the performance
board to the tester receiver), then the 25% point of the
reference driver waveform should be used, instead of the
midpoint - as specified below.
10.4.2.1 Exhaustive testing of all pins is impractical,
so a reduced set of representative conditions are used.
A non-binary pin sampling increment is used to ensure
that traditional binary architectural boundaries are
crossed.
10.4.2.2 The following nested loop outline describes
the test flow:
for amplitude = 3V
for pin = 1 to n by 3
for test_cycle = min, 2*min, 3*min, 10*min
for format_delay = 50% of test_cycle
for format = NR
for edge = rising, falling
detect midpoint of NR drive signal with
oscilloscope (averaging = 8)
detect midpoint of drive transition with
comparator (strobe compare mode)
error = (measured_delay - pro-
grammed_compare_delay -
zero_reference_measurement)
end edge
end format
end format_delay
end test_cycle
end pin
end amplitude
NOTE 3: Midpoint detection of the NR drive signal should be
done via a compare edge sweep technique.
10.4.3 Driver Transition Time Test — Since driver
transition time errors can be masked by compare timing
errors and comparator bandwidth limitations, an
external instrument is required to measure driver
transition time errors. The reference used for driver
transition time measurements is a high bandwidth-
digital sampling oscilloscope.
10.4.3.1 The tolerance for driver transition time
measurements is ± 150ps
11
due to the tester/instrument
11 This 150ps tolerance has been extended beyond 20ps due to level
sensitivities associated with oscilloscopes and typical bandwidth
variations in oscilloscope probes rendering transition time measurements
less accurate.

SEMI G80-0200 © SEMI 20009
interaction using a generic measurement method. The
signal measurement should be made with the driver
loaded with reference load A (500 ohms in parallel with
2.5pF ± 0.5pF of capacitance). The following nested
loop outline describes the test flow:
for amplitude = 1V, 3V, 5V (optional)
for pin = 1 to n
for edge = rising to falling
measure the 20% to 80% transition time of a
NR driver signal with test cycle = 10*min,
delay = 0s using oscilloscope (averaging = 8)
error = maximum transition time - minimum
transition time
end edge
end pin
end amplitude
10.4.3.2 The transition time measurements are to be
made between the measured 20% and 80% points of
both positive and negative signal edges, i.e., the 20%
and 80% points on the signal transition edge relative to
a 0% or 100% steady state level displayed on the
oscilloscope. Ideally, measurement points chosen
should be referenced to a steady state level that results
after all aberrations in the transition have expired. Use
the lowest tester pin as a reference channel when setting
the measurement points for these measurements.
10.4.3.3 ATE systems may use a focused calibration
routine for driver pins. That routine is intended to
correct edge error due to transition time variations. In
the context of executing this method for a machine that
has this capability, the user of this method is advised to:
1) Execute the Drive Input Transition Time Variation
test regardless, and 2) Enter the test results to the
method data summary, Table 2. The entry in Table 2
for transition variation will be a reference parameter.
This method as defined is incapable of making drive
edge error measurements that exclude transition
variation and jitter.
10.4.4 Driver Input Timing Cycle Jitter Test
12
—
Since driver input timing jitter cannot be determined
from Level 1 tests, an external instrument must be used
to measure short term, cycle to cycle (or period)
instability. This can be done by making period
measurements of the driver-input channel under test,
with a high bandwidth, digital sampling oscilloscope.
A 50-ohm probe should be used to minimize
measurement jitter. The tolerance for this test is ±
12 Trigger off the scope probe for this and the subsequent jitter test. Use
a high persistence display to show signal jitter. Use of a high bandwidth-
sampling oscilloscope with statistical capability is recommended.
Instrumentation jitter should be extracted from the measured signal jitter,
as explained in Appendix 4.
20ps
13
(min-max) due to the tester/instrument
interaction using a generic measurement method. The
measurement results are expressed as RMS. This
measurement depends on the jitter distribution being
Gaussian. Reference Appendix 4 for additional detail
regarding this measurement. If in the application of this
method it is determined that the jitter is non-Gaussian,
skip this test and make the appropriate notation on the
exceptions page (Appendix 3).
10.4.4.1 The following nested loop outline describes
the test flow:
for pin = 1 to n
for amplitude = 3V
for test_cycle = 2*min
for format = RTZ
for format_delay = 50%
for pulse_width = 50%
for i = 1 to 1000
meas(i) = measure the period of the pin under test
end i
measured signal jitter = RMS spread of meas(1)
through meas(1000)
end pulse_width
end format_delay
end format
end test_cycle
end amplitude
end pin
measured instrumentation jitter = RMS spread of
oscilloscope trigger
(method described further in Appendix 4)
actual RMS signal jitter = measured signal jitter -
measured instrumentation jitter
(via sum of squares - reference Appendix 4)
Reference load B (50 ohms to ground) should be used
for this measurement.
10.4.5 High Speed Clock Self-trigger Cycle Jitter Test
— If the ATE is configured with dedicated high speed
clock pins, an external instrument must be used to
measure short term, cycle to cycle (or period)
instability.
13 When recording measurement data, log all measurements as they are
taken from the measurement equipment and show the associated
equipment tolerances as a separate entity.