semi合集-English.pdf - 第6585页
SEMI C1-0705 © SEMI 1978, 2005 11 Figure of Merit Criteria for Successful Method Method Detection Limit Not illustrated in this example, an exam ple is provided with SEMI C10. The Method Detection Limit must be less than…
SEMI C1-0705 © SEMI 1978, 2005 10
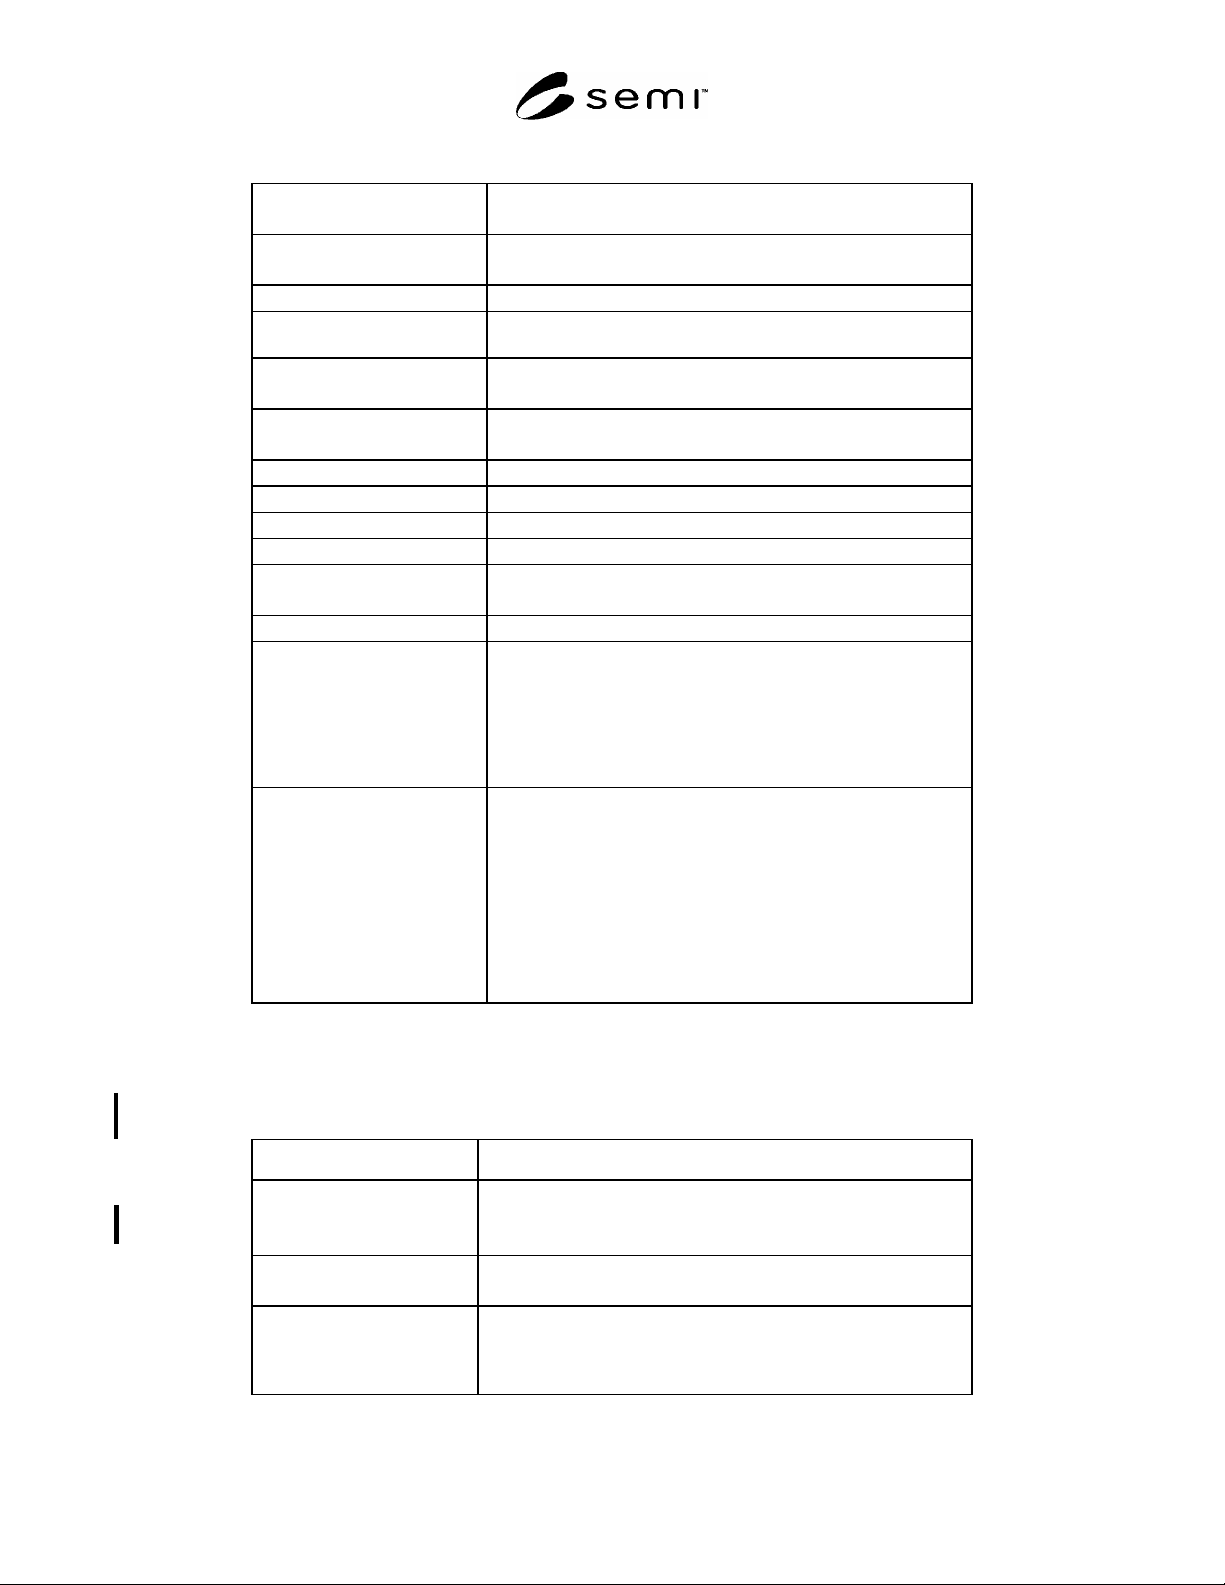
Table 5 Data Reporting – Example 6.1.7
Sample A (0.19 + 0.21 + 0.25 + 0.15 + 0.23) / 5
= 0.206
Sample B (0.31 + 0.21 + 0.17 + 0.22 + 0.26) / 5
= 0.234
Average (0.206 + 0.234) / 2 = 0.220
Spike The spike level is to be ½ the relevant specification. If the
specification is 1 ppb, then the spike would be 0.5 ppb.
Spike Sample C (0.83+0.62+0.76+0.79+0.80) / 5
= 0.760
Spike Sample D (0.77+0.87+0.69+0.83+0.84) / 5
= 0.800
Recovery 1 (0.760 – 0.220) = 0.540
% Recovery 1 (0.540 / 0.5) = 108
Recovery 2 (0.800 – 0.220) = 0.580
% Recovery 2 (0.580 / 0.5) = 116
Average % Recovery (108 + 116) / 2 = 112
% Recovery Range (116 – 108) = 8
Result Standard Deviation Since repeat measurements were available in this example, report
the sample standard deviations.
Sample A: 0.038
Sample B: 0.053
Sample C: 0.082
Sample D: 0.071
Relative Standard Deviation
(as a %)
Since repeat measurements were available in this example, report
the relative sample standard deviations.
Samp. A: 100 × (0.038 / 0.220) = 17.5
Samp. B: 100 × (0.053 / 0.220) = 24.2
Samp. C: 100 × (0.082 / 0.720) = 11.4
Samp. D: 100 × (0.071 / 0.720) = 9.9
Note use of the average of 0.220 and the sum of the average +
spike (0.720) above.
NOTE 3: This example provided the data for the first three success criteria found in Table 4 as well as providing other required
summary statistics. Table 6 summarizes performance relative to the success criteria.
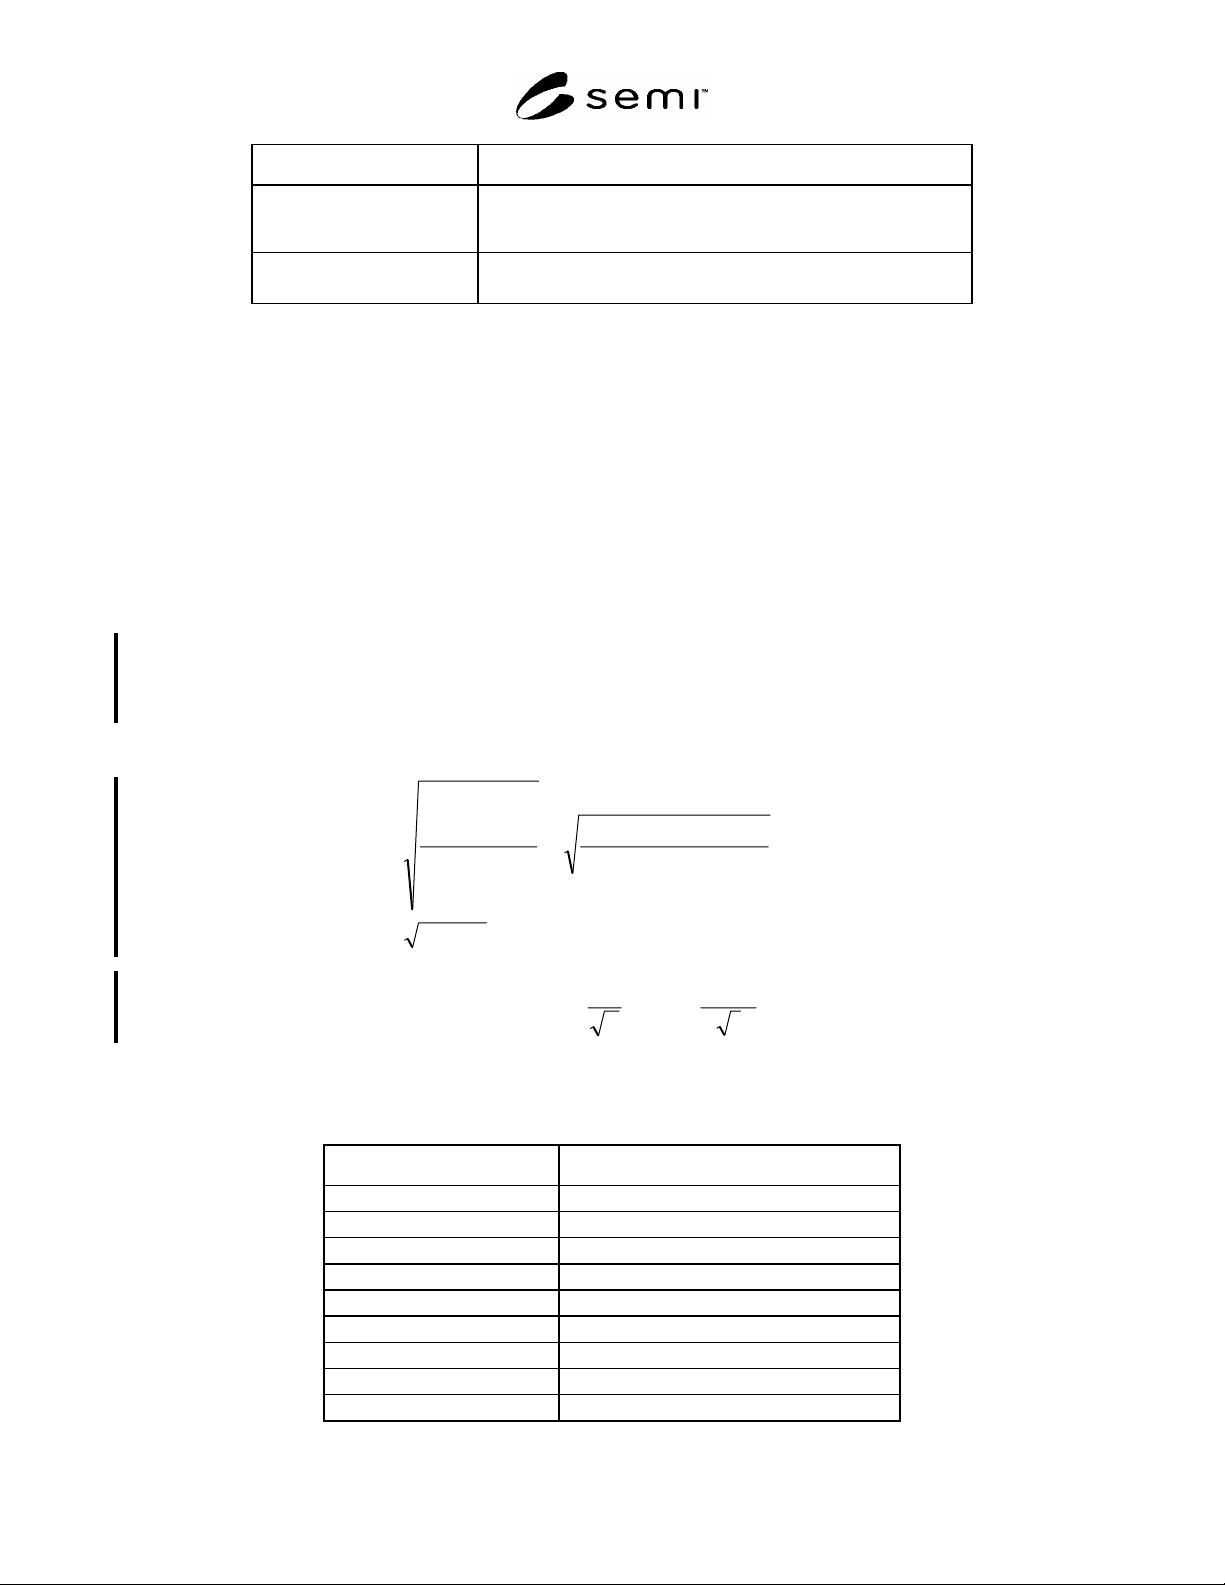
Table 6 Method Success Criteria for Trace Metals, Trace Anions, and Moisture –
Example 6.1.7
Figure of Merit Criteria for Successful Method
Accuracy
Recovery 1 (108%) as well as Recovery 2 (116%) are in the
required 75–125% Spiked Recovery range.
Method Precision
The % Recovery Range was 8% and meets the requirement of not
exceeding 35%.
Measurement Precision The maximum RSD for the spiked recoveries is 11.4% which is
less than the maximum allowable 20%. Note that the RSDs
calculated for Samples A and B are not relevant for this
requirement.
SEMI C1-0705 © SEMI 1978, 2005 11
Figure of Merit Criteria for Successful Method
Method Detection Limit Not illustrated in this example, an example is provided with SEMI
C10. The Method Detection Limit must be less than or equal to
the specification.
Interference Checks
List as necessary.
6.1.8 Example: Assay With Stated Upper and Lower Specification Limits — Suppose that the liquid chemical in
question has a target specification of 28% with a lower specification limit of 27% and an upper specification limit of
29%. The specification width is 2% = 29% 27%. Suppose the following data was available all as percentages:
Historical Sample A: 28.9, 29.1, 29.9
Historical Sample B: 27.8, 27.6, 27.6, 27.7
Current Sample: 28.1
For purposes of calculating the degrees of freedom and the pooled standard deviation as per Table 7:
009.0 ,4 ,280.0 ,3
2
22
2
11
snsn
,
Where
2
22
1
29.9) 29.1, (28.9, dev. std. )52915.0(280.0 s
2
2
2
27.7) 27.6, 27.6, (27.8, dev. std. 009.0 s
The degrees of freedom = 5 = (3-1) + (4-1) exceeds the minimum requirement of 4 and the pooled standard
deviation is calculated as:
343.01174.0s
32
)009.0(3)280.0(2
1n
s1n
s
p
N
1i
i
N
1i
2
ii
p
The 90% UCL is calculated as: 506.0
1
343.0
476.1 UCL%90
10.0,
n
s
t
p
df
Where n = 1 = number of current meas. taken on sample and the t statistic is from Table 7. Since the 90% UCL /
spec. width = 0.506/2 = 25.3% < 30% method validation is established.
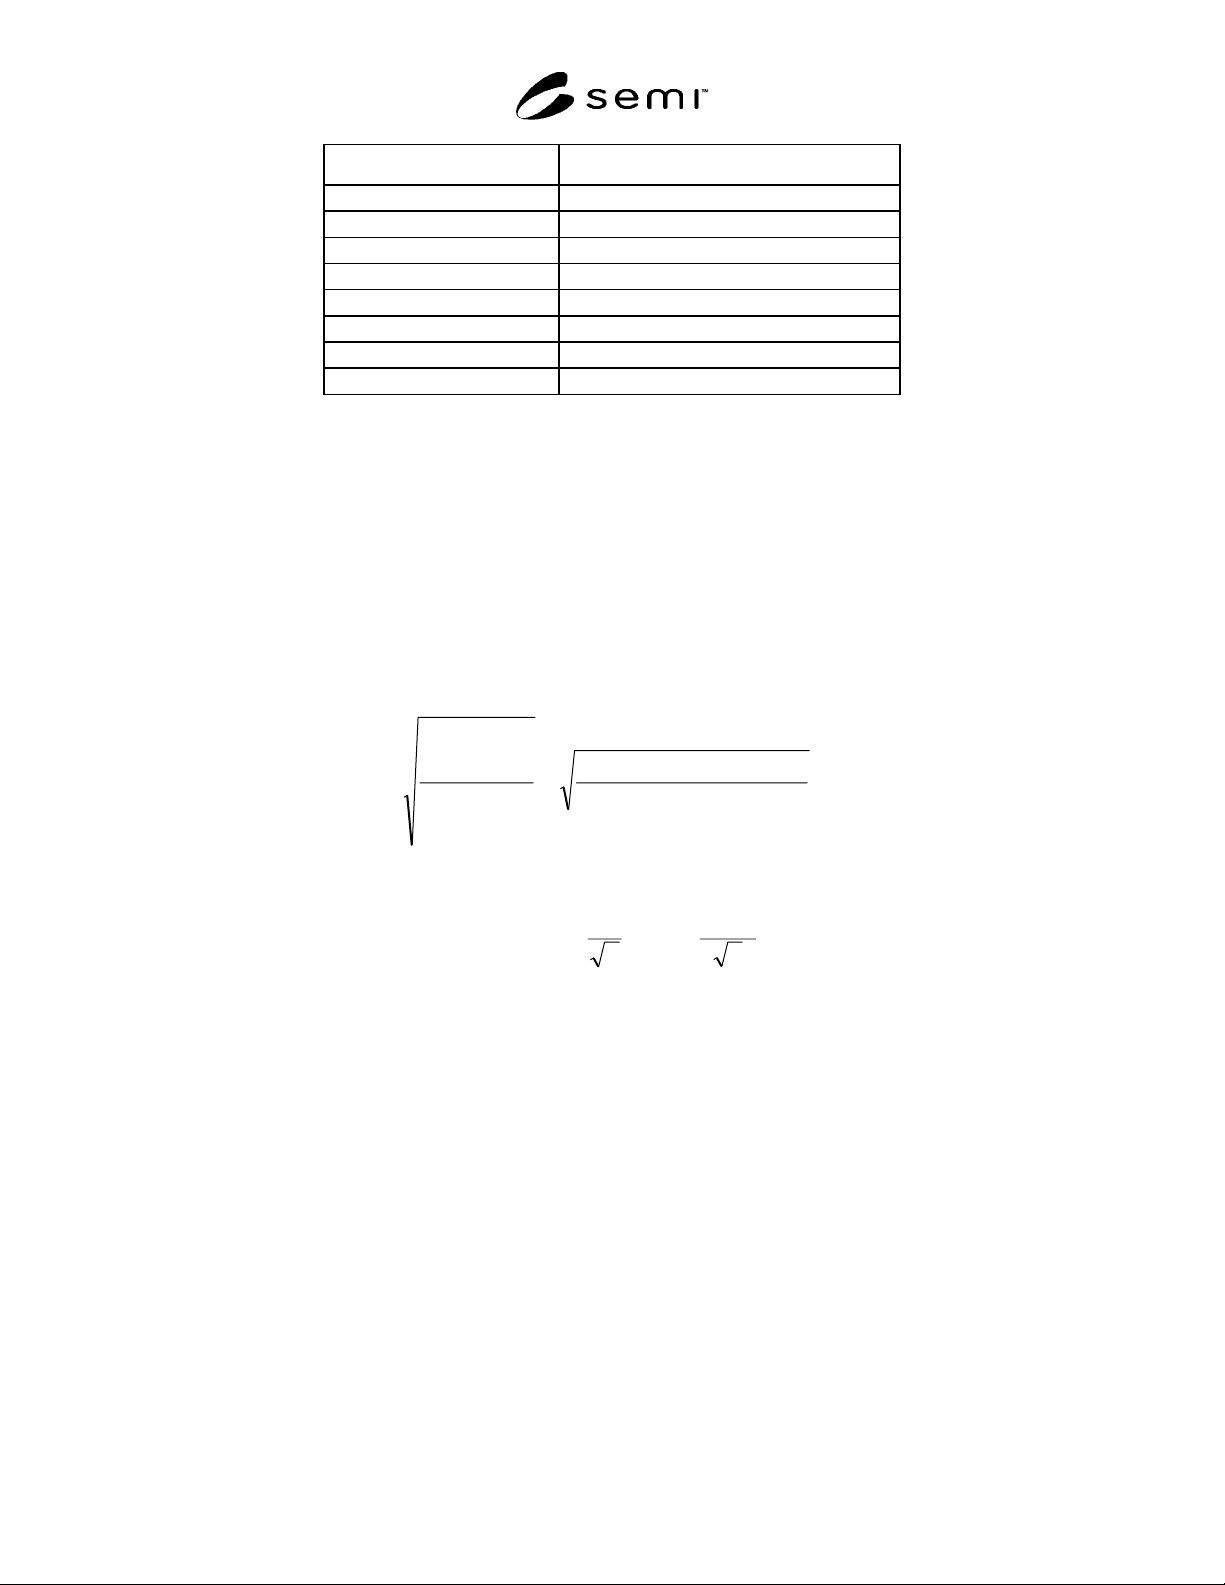
Table 7 t-statistics for Assay
Degrees of Freedom t-statistic
4 1.533
5 1.476
6 1.440
7 1.415
8 1.397
9 1.383
10 1.372
11 1.363
12 1.356
SEMI C1-0705 © SEMI 1978, 2005 12
Degrees of Freedom t-statistic
13 1.350
14 1.345
15 1.341
16 1.337
17 1.333
18 1.330
19 1.328
20 1.325
6.1.9 Example: Assay With Only a Stated Lower Specification Limit — Suppose that the liquid chemical in question
has a minimum purity level of 99.5%; i.e., a lower specification limit of 99.5% with an unstated upper specification
limit of 100%. The specification width is 0.5% = 100% - 99.5%. Suppose the following data was available all as
percentages:
Historical Sample A: 99.65, 99.63, 99.60 99.63
Current Sample: 99.58, 99.62
For purposes of calculating the degrees of freedom and the pooled standard deviation as per Table 3:
0008.0 ,2 ,000425.0 ,4
2
22
2
11
snsn
The degrees of freedom = 4 = (4-1) + (2-1) meets the minimum requirement of 4 and the pooled standard
deviation is calculated as:
023.0
13
)0008.0(1)000425.0(3
1
1
1
1
2
p
N
i
i
N
i
ii
p
s
n
sn
s
The 90% UCL is calculated as: 0249.0
2
023.0
533.1 UCL%90
10.0,
n
s
t
p
df
Where n = 2 = number of current meas. taken on the sample and the t statistic is from Table 7. Since the 90% UCL
/ spec. width = 0.0249/0.5 = 5.0% < 30% method validation is established.
7 Analytical Procedures
7.1 Acidity and Alkalinity
7.1.1 In the acidity test, usually a stated volume of water (commonly 25 mL) is shaken in a glass-stoppered flask
with a stated volume of sample (commonly 10 mL). Then 0.1 mL of phenolphthalein indicator solution is added and
0.01 N sodium hydroxide until a slight pink color persists after shaking for 30 seconds. Next, a stated amount of
sample is added and mixed, and a titration is performed with 0.01 N sodium hydroxide until the pink color is
reproduced; the volume of titrant required is recorded.
7.1.2 In the alkalinity test, a stated amount of sample is mixed with a stated volume of water (commonly 25 mL).
Now 0.05 mL of methyl red indicator solution is added and the mixture is titrated with 0.01 N hydrochloric acid
until a slight pink color is reached; the volume of titrant required is recorded.
7.1.3 The result of such tests has often been expressed qualitatively as “passes test” or quantitatively as the content
of an acid (or base) known or assumed to be present. In this guide, the maximum specification limit shall be
expressed in micro equivalents of acid (or base) per gram of sample (µeq/g). The maximum allowed volume of
titrant in a test procedure shall correspond to that specification limit.