semi合集-English.pdf - 第7527页
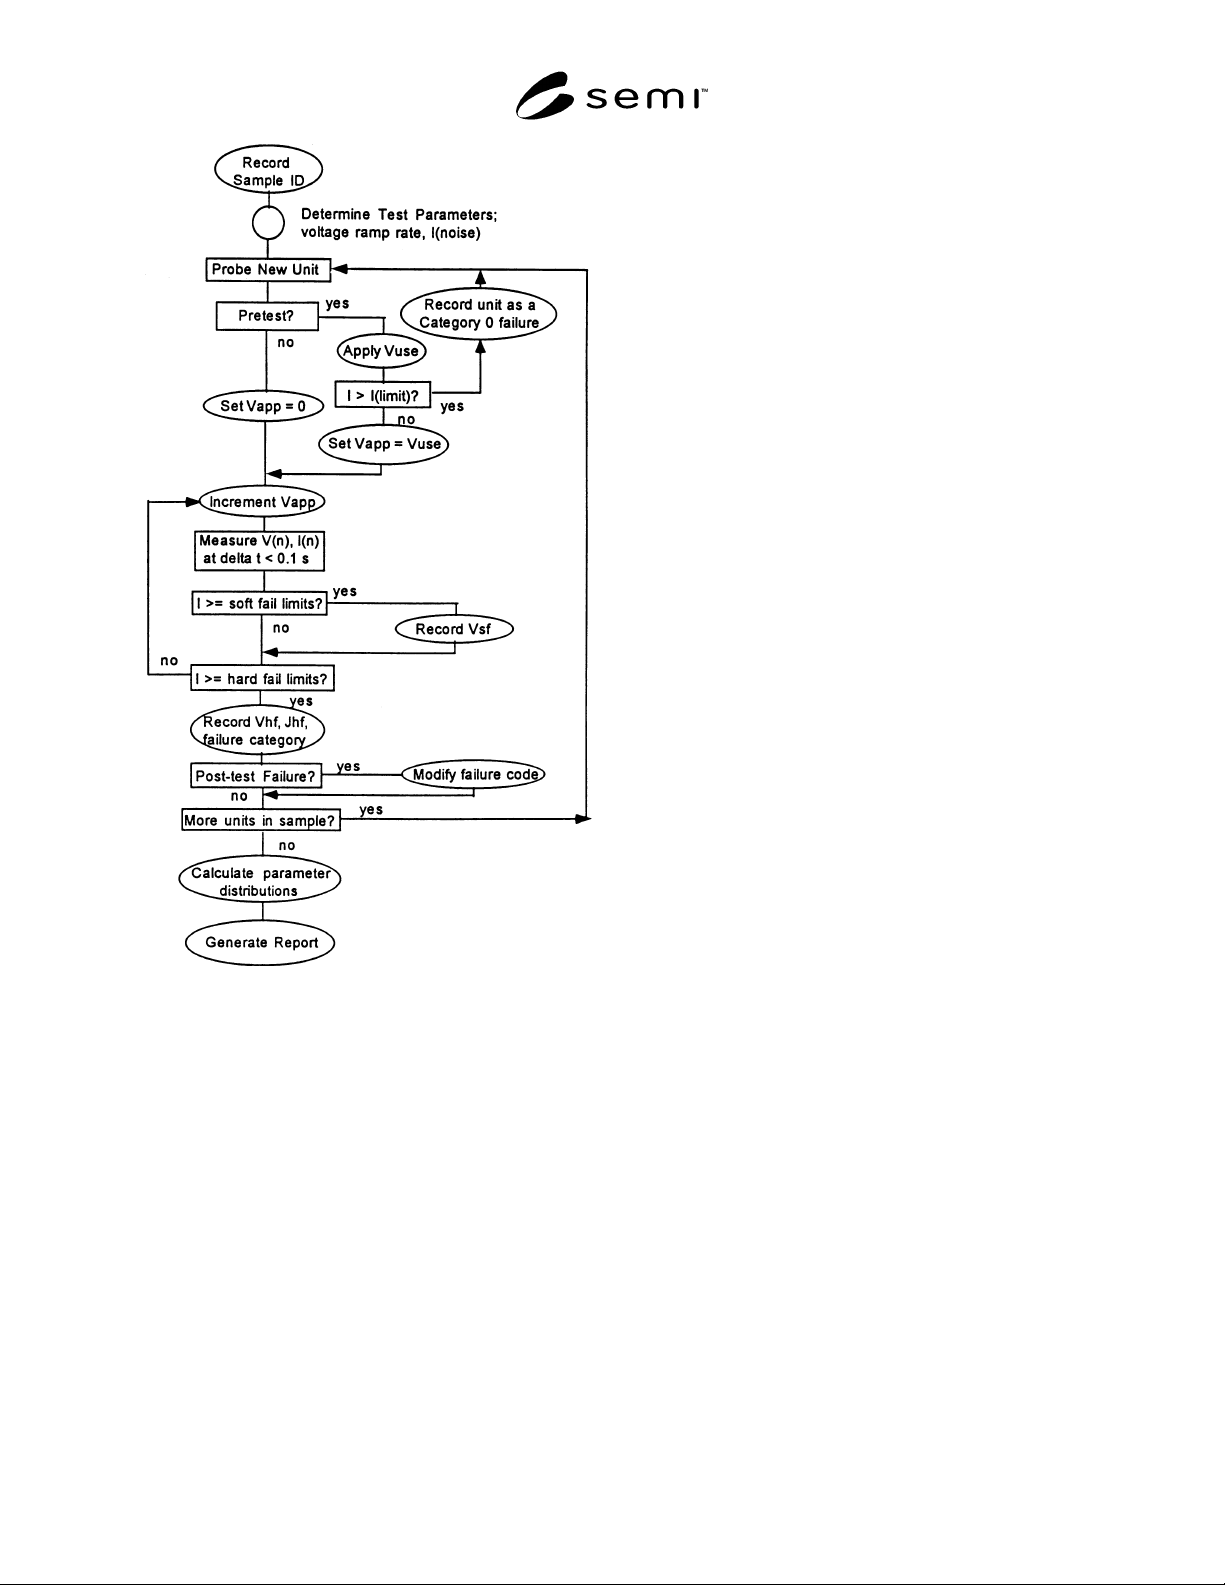
SEMI MF1771-0304 © SEMI 2003, 2004 4 Figure 1 Flow Diagr am for Ramp Voltage T est Method 5.1.3.2 These categories have traditional ly been used for oxides thicker than abou t 20 nm. For thinner films, care must be taken…
SEMI MF1771-0304 © SEMI 2003, 2004 3
make the material look worse than it might otherwise
appear if polysilicon gates are used. This is because the
process of forming a gate electrode on an oxide sample
may affect the integrity of that oxide either for better or
for worse. Sputtering or radiation damage
accompanying metal gate deposition may degrade oxide
integrity, while the high temperature annealing and
gettering associated with polysilicon deposition and
doping may improve oxide quality. On the other hand,
stress arising from crystal formation in the polysilicon,
or impurity diffusion along polysilicon grain boundaries
may degrade oxide integrity. Changes of gate-substrate
work function difference may also affect the breakdown
and wearout mechanisms in the oxide. Therefore,
potential effects of gate electrode material choice on
test results must not be neglected.
3.7 The actual values obtained depend somewhat on
the processing involved in fabricating the test structure.
Care must be taken to ensure a consistent processing.
3.8 Wafer temperature during testing should be clearly
defined. While oxide breakdown voltages are not
strongly temperature-dependent, the oxide wearout
mechanism is temperature-sensitive, and large
temperature variations might have an impact on results.
3.9 Warning — Since the voltage and currents
involved are potentially dangerous, appropriate means
of preventing the operator from coming into contact
with the probe tip or other charged surfaces should be
in place before testing.
3.10 When testing very thin oxides, those 10 nm or less
in thickness, special care must be taken to account for
effects arising from the very high specific capacitance
of these films. These may include voltage drops across
the polysilicon gate electrode and the silicon substrate,
and high conduction due to direct tunneling.
3.11 When using a mercury probe for measurements of
this type, care must be taken in the preparation and
control of the oxide surface. Adsorbed organic
contaminant films may affect the electric field
distribution in the oxide. Such films may sometimes be
removed with hot SC-1 cleaning solution; a mixture of
NH
4
OH-H
2
O
2
-H
2
O. Use of a dry nitrogen purge of the
probing ambient is also recommended to minimize
surface contamination effects.
4 Referenced Standards
4.1 SEMI Standard
SEMI M51 — Test Method for Characterizing Silicon
Wafers by Gate Oxide Integrity
4.2 EIA/JEDEC Standards
1
Standard 35 — Procedure for the Wafer-Level Testing
of Thin Dielectrics
Standard 35-1 — General Guidelines for Designing
Test Structures for the Wafer-Level Testing of Thin
Dielectrics
Standard 35-2 — Test Criteria for the Wafer-Level
Testing of Thin Dielectrics
NOTICE: Unless otherwise indicated, all documents
cited shall be the latest published versions.
5 Terminology
5.1 Definitions
5.1.1 hard failure — destructive failure of an MOS
capacitor associated with rupture of the oxide film.
5.1.1.1 Discussion — This is sensed by an abrupt,
irreversible change in the current-voltage characteristics
of the capacitor. In this test method, hard failure is
determined by a relatively large change in dc
conduction level between voltage steps, or as a change
in the logarithmic slope of the current density-voltage
characteristic.
5.1.2 soft failure — failure of an MOS capacitor sensed
by its passage of an electrical current equal to or greater
than a predetermined value.
5.1.2.1 Discussion — This type of failure may be either
destructive or nondestructive, as in the case of Fowler-
Nordheim or direct tunneling currents.
5.1.3 failure modes A, B, and C — in the reporting of
hard and soft breakdown failure results, data is
sometimes summarized in terms of ranges of oxide field
strength in which the breakdown occurred.
5.1.3.1 Discussion — One set of categories widely
used
2
,
3
is as follows:
• A mode failure: E
ox
< 1 MV/cm
• B mode failure: 1 MV/cm ≤ E
ox
≤ 8 mV/cm
• C mode failure: 8 MV/cm < E
ox
1 Available from Electronic Industries Alliance, 2500 Wilson Blvd.,
Arlington, VA 22201 USA. Tel: 703-907-7500, Fax: 703-907-7501,
Website:
www.eia.org.
2 Yamabe, K., Ozawa, Y., Nadahara, S., and Imai, K., “Thermally
Grown Silicon Dioxide with High Reliability,” in Semiconductor
Silicon 1990, Proceedings Volume 90-7, The Electrochemical
Society, (Pennington, NJ, 1990) pp. 349-363.
3 Yamabe, K., Taniguchi, K., and Matsushita, Y., “Thickness
Dependence of Dielectric Breakdown Failure of Thermal SiO2
Films,” Reliability Physics—21st Annual Proceedings, 1983, p. 184.
SEMI MF1771-0304 © SEMI 2003, 2004 4
Figure 1
Flow Diagram for Ramp Voltage Test Method
5.1.3.2 These categories have traditionally been used
for oxides thicker than about 20 nm. For thinner films,
care must be taken in their use and in proper derivation
of the oxide field strengths as described in Section 10.2.
The break point between A mode and B mode failure in
this set of categories is different from the 3 MV/cm
given in SEMI M51.
6 Summary of Test Method
6.1 A flow diagram for the ramp voltage test is
pictured in Figure 1.
6.2 Record the test specimen ID and other test identity.
6.3 Establish the test parameters relevant to the test
system and to the test specimen.
6.4 A capacitor unit on the test specimen is selected for
test, and an optional pretest of capacitor leakage is
carried out, if desired.
6.5 If the capacitor fails this pretest, the capacitor is
recorded as a category 0 failure and a new capacitor on
the test specimen is selected for test.
6.6 Otherwise, the voltage on the capacitor is set to 0
(if no pretest was conducted) or to the voltage of use (if
a pretest was carried out).
6.7 The voltage applied to the capacitor under test is
increased linearly with time at a specified rate, with
measurements of current made at intervals that must
correspond to oxide electric field changes less than a
maximum specified value.
6.8 The voltage ramp continues until hard failure
(destructive breakdown), as defined by one of several
specified failure criteria, is sensed and stored along
with the appropriate hard failure criterion.
6.9 During the measurement cycle, soft failures
corresponding to predetermined current levels are
sensed and stored.
6.10 The measurement cycle for this capacitor is
completed when hard failure is detected or when the
upper voltage limit of the test is reached.
6.11 After the test is completed (without observing
hard failure), a post-test is performed to evaluate hard
failure by sensing current at a low voltage.
6.12 The test cycle is then repeated for the next
capacitor in the array, and this is continued until all
units in the specified group have been tested.
6.13 When testing is complete, calculations and cate-
gorizing of data is done and a report is generated.
7 Apparatus
7.1 Although the test method is independent of
equipment configuration, the use of computer-
controlled probing equipment is essential as the
measurement speed precludes manual data gathering.
What is included here shall be considered a minimum.
7.1.1 Voltage Source and Sink — That is capable of
delivering/receiving between 0 and ± 100 V in the form
of an effective ramp rate of 1.0 ± 0.1 MV/cm
–1
/s
–1
either
automatically or under computer control. If use of
other ramp rates is mutually agreed upon (see Section
9.6), it must be established that hardware is available to
perform the measurement adequately. This voltage
source/sink may consist of two source-measurement
units (SMU' s) with a common ground, or just a single
SMU with a dedicated sink. The voltage source shall
be capable of sourcing at least 100 mA of current.

SEMI MF1771-0304 © SEMI 2003, 2004 5
7.2 Shielded Triaxial Cables — Involving guarding to
minimize the noise when measuring low current values.
7.3 Wafer Chuck — Electrically isolated from its
case/probe platen. While the chuck may be connected
to the reference voltage (zero, not ground), lower
electrical noise may be obtained by connecting the
voltage ramp source to the chuck and measuring the
current through the probe connection.
7.4 Probe — To contact the gate electrode. Either a
hard needle-type probe such as tungsen carbide (which
may be a single probe or a probe card) or a mercury
probe may be used.
8 Sampling
8.1 Sampling is the responsibility of the user of this
test method. However, if testing is done as part of a
comparison or correlation, sampling shall be agreed
upon in advance by all participants.
NOTE 2: Refer to the appendix of Standard 35 for a good
discussion of sampling plan statistics.
9 Procedure
9.1 Before the measurement, record the following
information for each sample: sample identity, date,
time, operator, instrument station identity (if any),
average oxide thickness, gate area in square
centimeters, gate material, oxide type (example thermal
versus deposited), structure type, conductivity type (n
or p), bias mode (accumulation or depletion), test
temperature.
9.2 Establish the test parameters relevant to the test
system and the sample. These include the voltage ramp
rate, computed in accordance with the calculation in
Section 10.2, and the noise threshold level and in some
instances the ln J-V slope ratio for the hard failure
criterion in Section 9.9.5, both determined in
accordance with the calculation in Section 10.3.
9.3 Set the applied voltage to zero volts.
9.4 Recognizing that some information on extrinsic
defects may be lost, perform a pretest as follows. If it is
desired not to lose the information on extrinsic defects,
proceed to Section 9.5.
9.4.1 Bias the gate into accumulation at the voltage of
use. If the measured current exceeds a value equivalent
to 1.0 × 10
–5
A/cm
2
(or a current value of 10 nA if the
device area is at or below 10
–3
cm
2
), record this device
as a Category 0 failure and proceed to Section 9.11.
9.5 From the starting bias condition (zero if no pretest
was done, or the voltage of use if a pretest was used)
record voltage and current.
9.6 Begin increasing the voltage bias at a rate
equivalent to an electric field increment of 1.0 ± 0.1
MV-cm
–1
-s
–1
. Note that other ramp rates may be used
if it can be shown that it does not affect the results, or if
it is agreed upon by all parties to the test.
9.7 Record current-voltage data at an interval no more
than 0.1 s between readings, or at least once near the
end of each voltage step.
9.8 After each current reading, test to see if any of the
soft failure criteria have been met. If so, store the
appropriate value.
9.9 After each current reading, check to see if one of
the hard failure criteria has been reached.
9.9.1 Check to see if the current has increased to a
value greater than or equal to 0.98 times the compliance
limit of the voltage ramp source. If so, record the
previous voltage level as the hard failure voltage, and
set the failure category to 1. Divide the current level at
the previous measurement point by the capacitor area,
and record this value as the hard failure current density
for this unit.
9.9.2 Check to see if the current has increased by a
factor of 1000 or more from the previous reading. If so,
record the previous voltage level as the hard failure
voltage, and set the failure category to 2. Divide the
current value measured at the previous point by the
capacitor area, and record this value as the hard failure
current density.
9.9.3 Check to see if the current has increased by a
factor of 10 or more in two consecutive voltage steps.
If so, record the previous voltage level as the hard
failure voltage, and set the failure category to 3. Divide
the current value measured at the previous point by the
capacitor area, and record this value as the hard failure
current density.
9.9.4 If the current is above the noise threshold level,
check for an abrupt increase in the current by a factor of
ten. If this has occurred, record the previous voltage
level as the hard failure voltage, and set the failure
category to 4. Divide the current value measured at the
previous point by the capacitor area, and record this
value as the hard failure current density.
9.9.5 If the current is above the noise threshold level,
check for an abrupt change in the logarithmic slope of
the current density-voltage characteristic of the unit.
To minimize the chance of detecting a false reading,
use the average of the previous five (V,I) data pairs to
compute the established slope, and the current and
previous (V, I) data pairs to compute the new slope. A
change by a factor of three shall constitute a failure. If
this has occurred, record the previous voltage level as
the hard failure voltage, and set the failure category to