semi合集-English.pdf - 第7331页
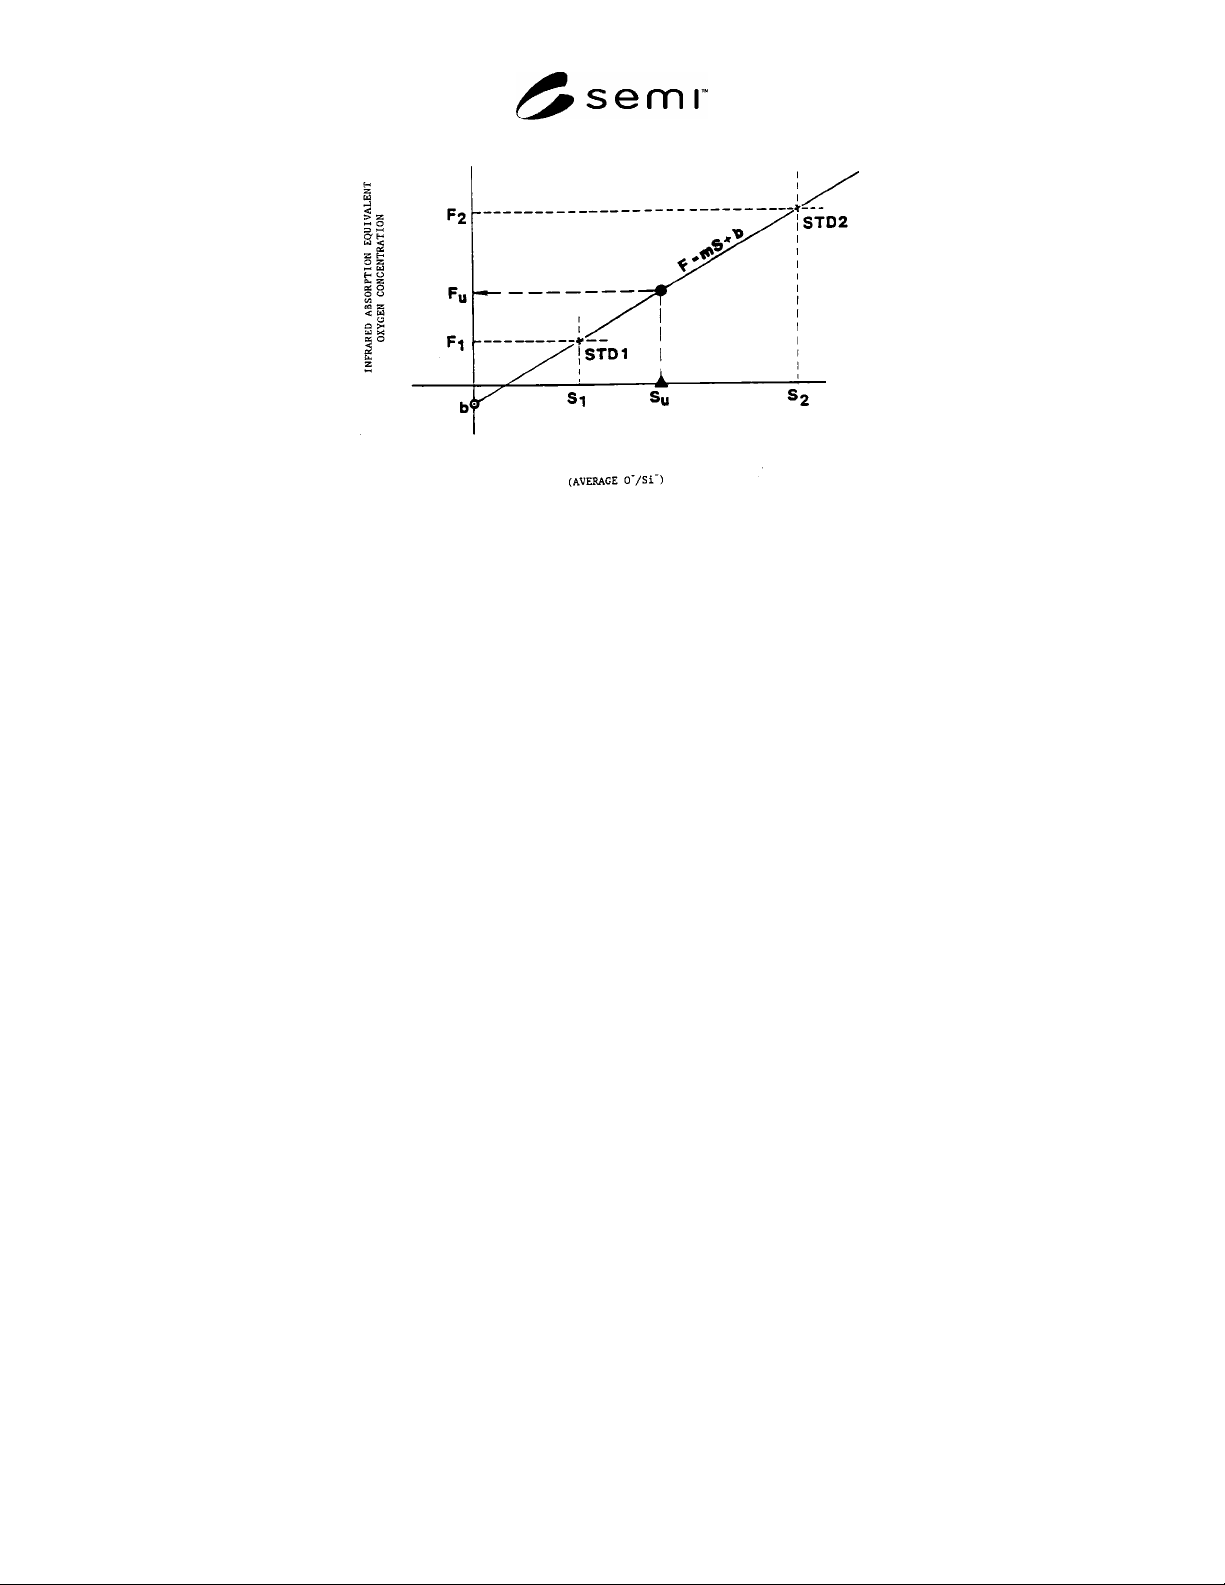
SEMI MF1366-0305 © SEMI 2003, 2005 6 Figure 1 Load Line Ca libration f or SIMS B ulk Oxyge n Analysis 12.2.3 Convert the SIMS O /Si ratios S u for each test specimen to the infrare d absorption equivalent value F u b…

SEMI MF1366-0305 © SEMI 2003, 2005 5
11.4.6 Repeat ¶11.4.4 and ¶11.4.5 for a third and fourth round of measurements, all in their own separate craters.
Group all the analyses for each specimen near the center of the window but do not overlap. The raster area for each
analysis must be the same.
11.4.7 Calculate the ratio S(O
/Si
) of oxygen count rate to silicon count rate using the recorded secondary ion
intensities at the end of each profile in the second, third, and fourth rounds of profiles, thus obtaining three ratios per
specimen.
11.4.8 Calculate the average S
avg
(O
/Si
) of the three ratios for each specimen in the holder.
11.4.9 Compare the average ratio S
avg-FZ
(O
/Si
) for the float zone specimen to the average ratio S
avg-sp
(O
/Si
) of
the other specimens. If the average ratio for the float zone specimens is not much less (approximately 10 times less)
than the average ratio for the other specimens, then the precision of the measurement may be degraded. In this case,
depending upon the desired precision, it may be necessary to either abort the analysis and find the cause of the high
instrumental background, or to increase the number of measurements per specimen.
11.4.10 Calculate the relative standard deviation (RSD percent) of the ratio S(O
/Si
) for each specimen, including
the calibration specimen, the float zone specimen, and the test specimen.
11.4.11 Repeat the analysis of oxygen for specimens (other than float zone specimens) with a RSD percent greater
than 3%.
11.4.12 Record the specimen identification, O
/Si
ratios, average, standard deviation, and relative standard
deviation in a table and include the same for the float zone silicon specimen.
12 Calculations
12.1 Load Line Calibration Procedure
12.1.1 Calculate the slope m and intercept b of the load calibration line of infrared absorption oxygen values F
versus the SIMS average O
/Si
ratios S for the standards as follows:
bmSF
(1)
where m and b are calculated from the assigned infrared absorption oxygen values F
1
and F
2
of the two calibration
standards and S
1
and S
2
are the measured average ratios of the O
/Si
for the two calibration standards.
)(
)(
21
21
SS
FF
m
(2)
)(
)(
12
1221
SS
SFSF
b
(3)
12.1.2 Convert the SIMS O
/Si
ratios S
u
for each test specimen and for the float zone specimen to the infrared
absorption equivalent value F
u
based on the calibration line (Equation 1) and as illustrated in Figure 1.
12.2 Load Factor Calibration Procedure
12.2.1 Calculate the calibration load factors, LF
1
= F
1
/S
1
and LF
2
= F
2
/S
2
, of the assigned infrared absorption
oxygen F to the S ratio O
/Si
from the standard samples using the average ratios of the O
/Si
from the calibration
standards.
12.2.2 Calculate the average load factor, LF
avg
, as follows:
2
)(
21
LFLF
LF
avg
(4)
SEMI MF1366-0305 © SEMI 2003, 2005 6
Figure 1
Load Line Calibration for SIMS Bulk Oxygen Analysis
12.2.3 Convert the SIMS O
/Si
ratios S
u
for each test specimen to the infrared absorption equivalent value F
u
by
multiplying the S
u
by the average load factor LF
avg
derived from the calibration standards, as follows:
avguu
LFSF
(5)
13 Report
13.1 Report the following information:
13.1.1 The instrument used, the operator, and the date of the measurements,
13.1.2 Identification of test and standard specimens,
13.1.3 Calibration procedure used,
13.1.4 The infrared absorption equivalent oxygen values for the test specimen and the float zone silicon specimen,
and
13.1.5 The relative standard deviations (RSD percent) of the oxygen values for the test specimen and the float zone
silicon.
14 Precision
14.1 The precision was estimated for both the load line calibration and average load factor calibration procedures
using 191 samples from one silicon wafer and measured in 191 different loads over a two-month period. The one
standard deviation was 0.38 ppma for both methods for an oxygen level of 18 ppma. The data are given in
Appendix 1.
14.2 The load line and average load line methods to quantification gave equivalent accuracy and precision in the
test outlined in ¶14.1. The reason one is used versus another is more conceptual than empirical if the oxygen values
for the standards bracket the oxygen values of the test specimens.
15 Keywords
FTIR; oxygen; secondary ion mass spectrometry; silicon
SEMI MF1366-0305 © SEMI 2003, 2005 7
APPENDIX 1
ANALYSIS OF DATA FROM THE MULTI-INSTRUMENT EXPERIMENT
NOTICE: The material in this appendix is an official part of SEMI MF1366. Approval was by full letter ballot
procedures with publication authorized by the NA Regional Standards Committee on December 10, 2004.
A1-1 The precision estimate was taken from data generated in one laboratory using three instruments and ten
instrument operators. All the instruments were CAMECA IMS 3f or 4f SIMS instruments. The test specimens were
all taken from one silicon wafer that was lightly doped and verified by infrared absorption spectroscopy to have
uniform interstitial oxygen levels across the central region where the test specimens were taken. The test specimens
were chemically mechanically polished on one side. The standards had oxygen levels that bracketed the expected
level of oxygen of the test specimen.
A1-2 The measurements were made in 191 loads over a two-month period.
A1-3 Both the load line calibration and the average load factor calibration methods were used to convert the SIMS
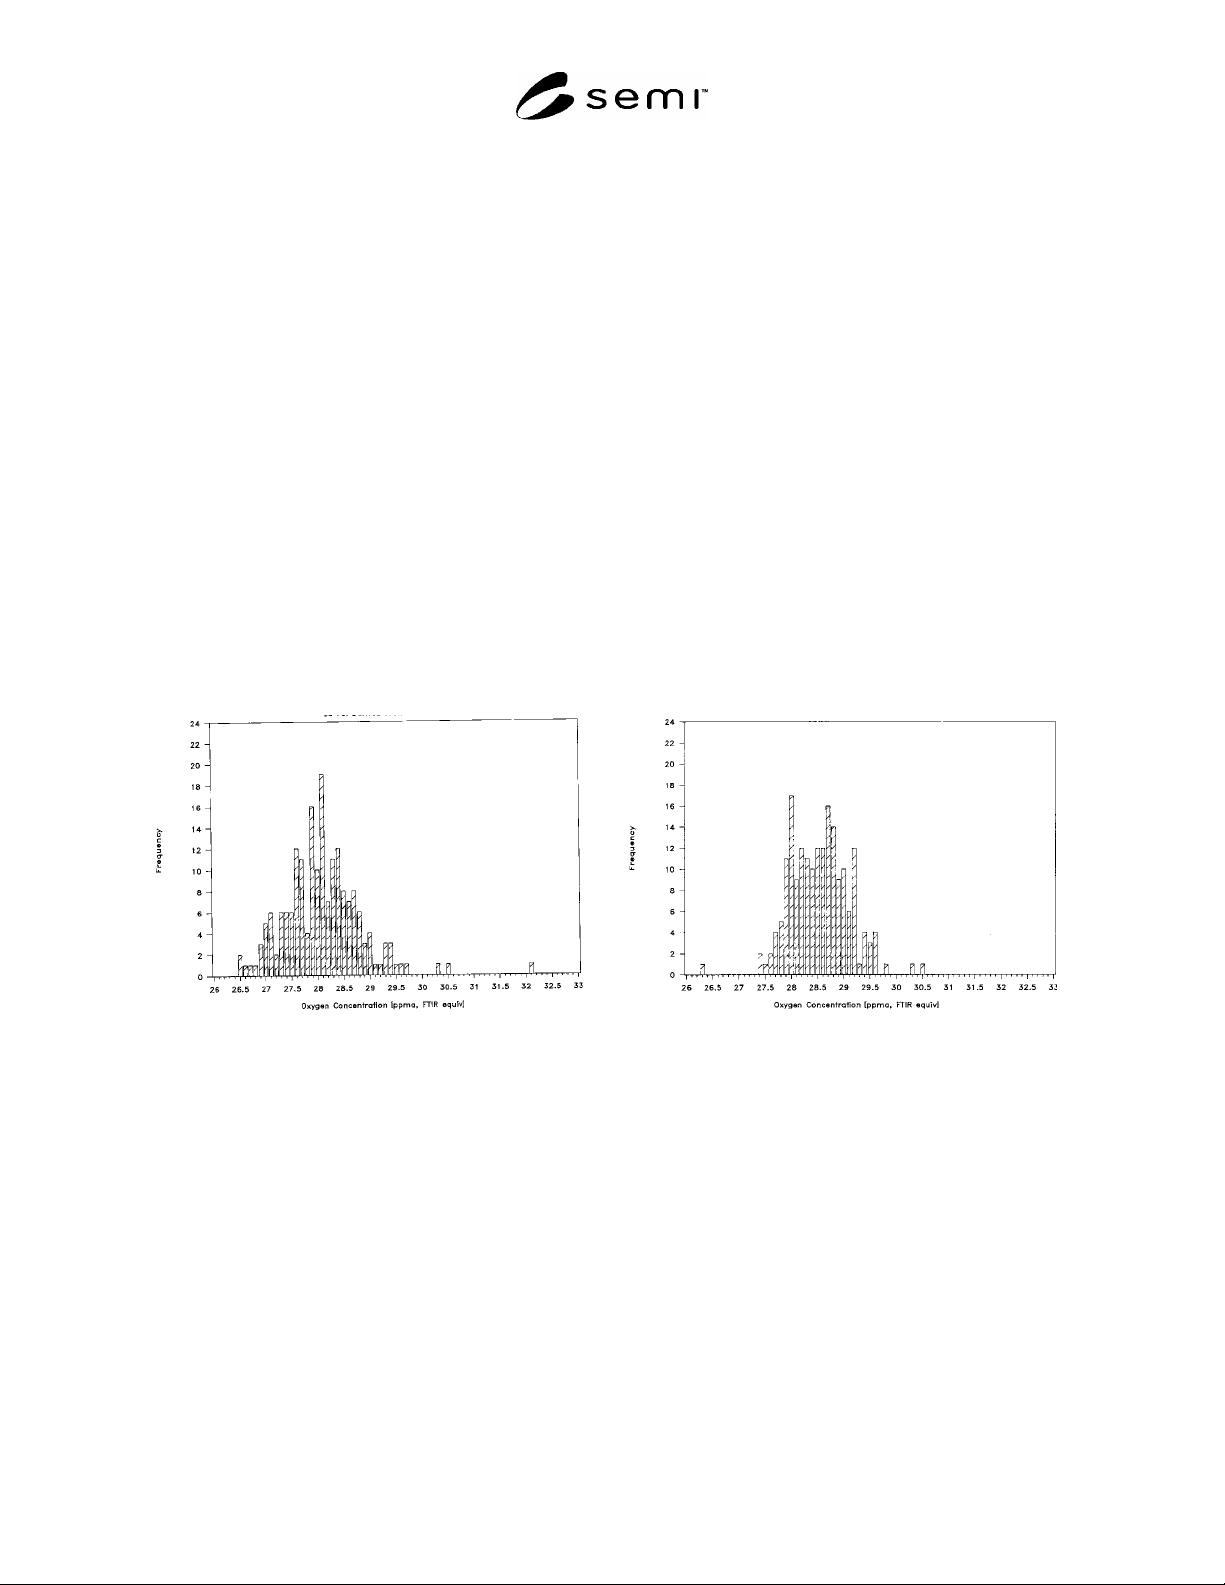
data to infrared absorption equivalent oxygen. The load line calibration method gave an average oxygen level of
18.64 ppma (IOC-88), a one standard deviation of 0.39 ppma, and a relative standard deviation of 2.09%. A
frequency distribution is shown in Figure A1-1. The average load factor calibration method gave an average oxygen
level of 18.61 ppma (IOC-88), a one standard deviation of 0.365 ppma, and a relative standard deviation of 1.97%.
A frequency distribution is shown in Figure A1-2.
NOTE 1: The oxygen concentration scale in Figures A1-1 and A1-2 is given in Old ASTM units. These must be multiplied by
0.652 to get the values of oxygen concentration in IOC-88 units. This difference in scale arises from an historical basis and does
not affect the conclusions reached. Note also that the oxygen values in §A1-3 have been adjusted to obtain the results in IOC-88
units.
Figure A1-1
Frequency Distribution of SIMS Measured Oxygen
Using the Load Line Calibration Method
Figure A1-2
Frequency Distribution of SIMS Measured Oxygen
Using the Average Load Factor Calibration Method
NOTICE: SEMI makes no warranties or representations as to the suitability of the standards set forth herein for any
particular application. The determination of the suitability of the standard is solely the responsibility of the user.
Users are cautioned to refer to manufacturer's instructions, product labels, product data sheets, and other relevant
literature, respecting any materials or equipment mentioned herein. These standards are subject to change without
notice.
By publication of this standard, Semiconductor Equipment and Materials International (SEMI) takes no position
respecting the validity of any patent rights or copyrights asserted in connection with any items mentioned in this
standard. Users of this standard are expressly advised that determination of any such patent rights or copyrights, and
the risk of infringement of such rights are entirely their own responsibility.
Copyright by SEMI® (Semiconductor Equipment and Materials
International), 3081 Zanker Road, San Jose, CA 95134. Reproduction of
the contents in whole or in part is forbidden without express written
consent of SEMI.