semi合集-English.pdf - 第5871页
SEMI P35-0704 © SEMI 2000, 2004 6 dispersion of the values that could reason ably be attributed to the pitch between two p arallel lines (see measurement uncertainty ). 5.1.14.3.1 One option her e is to choose inne r and…
SEMI P35-0704 © SEMI 2000, 2004 5
5.1.9 measurand — particular quantity subject to
measurement [reference Section 6.1].
5.1.10 measurement error — result of a measurement
minus a true value of the measurand [reference Section
6.1].
NOTE 7: The measurement error is unknown because the
true value is unknown. Otherwise there would be no need to
measure.
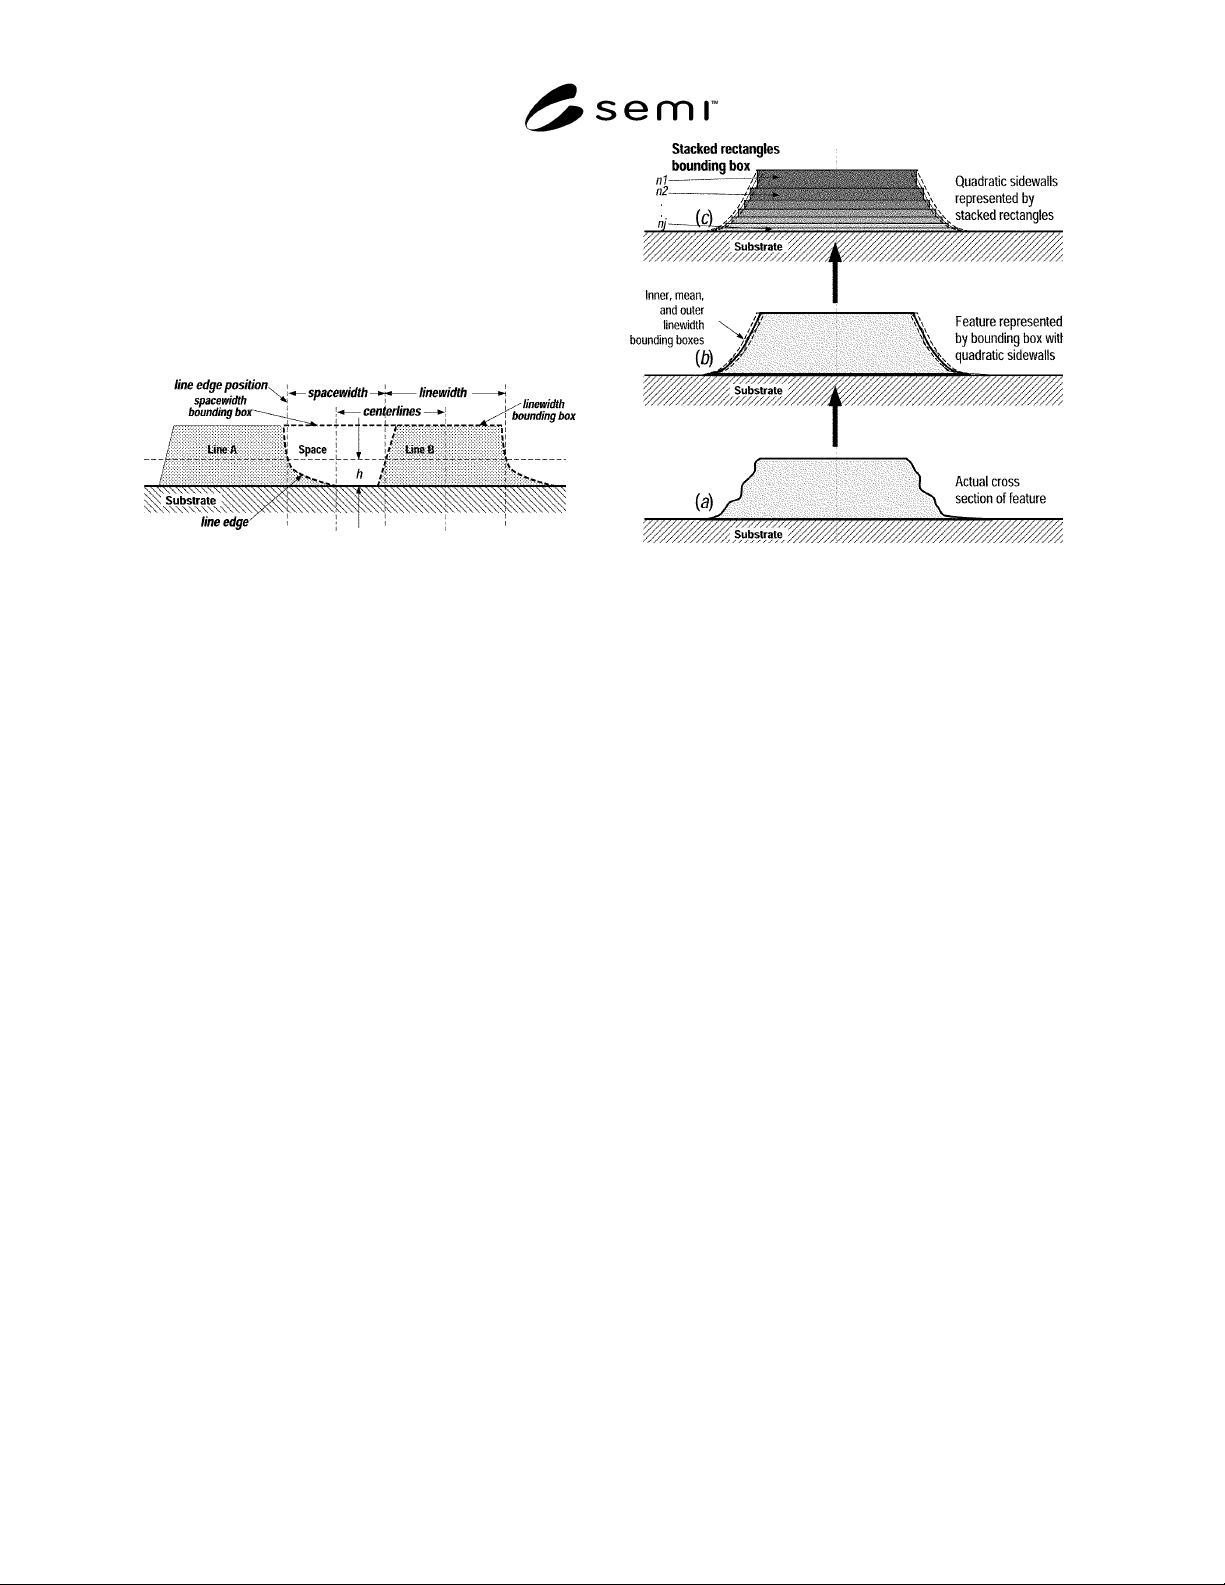
Figure 6
Example of linewidth (and spacewidth) after the
definition in SEMI P19. Since the intention in this
case is to conform to the irregular shape of the edge,
the generalized linewidth bounding box definition (b)
is used. The inner, outer, and mean linewidth
bounding boxes coincide, and the linewidth is defined
to be the width of the mean linewidth bounding box
at a specified distance h above the substrate.
Alternatively, the line edge bounding box approach
can be used here, giving the same results.
5.1.11 measurement uncertainty — parameter,
associated with the result of a measurement, that
characterizes the dispersion of the values that could
reasonably be attributed to the measurand [reference
Section 6.1]. Numerically, it is the square root of the
sum of the variances of the probability distributions of
all the possible errors (both random and systematic),
multiplied by a stated factor chosen to represent the
desired confidence interval (usually 2 for 95% or 3 for
99% for normally distributed errors), as described in
ANSI/NCSL Z540- 2-1997 [reference Section 3.2].
Figure 7
Example of stacked-rectangle linewidth feature
model for a chrome photomask line, consistent with
common imaging models. For an optical metrology
system the stacked rectangles may have different
complex indices of refraction. For an SEM they may
have different atomic numbers. The edge bounding
box will have some additional width to account for
line edge roughness.
5.1.12 overlay — vector distance between the feature
placements of two corresponding features created at
different processing levels, in the reference plane
coordinate system.
5.1.13 pattern — set of one or more features.
5.1.13.1 pattern placement — coordinates describing
the centroid of the set of features comprising the
pattern in the reference plane relative to a coordinate
system in that plane.
5.1.14 pitch
5.1.14.1 pitch in general — the centroid-to-centroid
distance between the feature models describing two
features, i.e., the distance between the two feature
placements.
5.1.14.2 pitch between parallel lines — (a) the
centroid-to-centroid distance between the linewidth
bounding boxes describing two parallel lines, over a
specified length segment common to both, and
perpendicular to their edges. (b) right edge to right-edge
or left-edge to left-edge distance between
corresponding line edge bounding boxes, or the
centerline-to-centerline (preferred) distance, can also be
used where appropriate, if so specified.
5.1.14.3 pitch measurement uncertainty (between
parallel lines) — parameter that characterizes the

SEMI P35-0704 © SEMI 2000, 2004 6
dispersion of the values that could reasonably be
attributed to the pitch between two parallel lines (see
measurement uncertainty).
5.1.14.3.1 One option here is to choose inner and outer
linewidth bounding boxes so that there is a 95% chance
that the features’ true edges lie between their respective
inner and outer linewidth bounding boxes. Then the
pitch measurement uncertainty will be the combined
uncertainties of the measured distance between the
centroids of the feature mean linewidth bounding boxes
and the uncertainties of the differences of the positions
of the left edges and of the right edges within their
respective line edge bounding boxes. This option is the
default.
5.1.15 precision
5.1.15.1 static precision — repeatability
5.1.15.2 dynamic precision — reproducibility
5.1.16 reference plane — in the context of this
document, a user-defined plane approximating the
surface of a substrate and containing a coordinate
system.
NOTE 8: All dimensional measurement data are referred to
the reference plane coordinate system.
5.1.17 repeatability (of results of measurements) —
closeness of the agreement between the results of
successive measurements of the same measurand
carried out under the same conditions of measurement
[reference Section 6.1].
5.1.18 reproducibility (of results of measurements) —
closeness of the agreement between the results of
measurements of the same measurand carried out under
changed conditions of measurement. [reference Section
6.1]
5.1.19 resolution
5.1.19.1 measurement resolution — smallest difference
in the measurand that can be meaningfully
distinguished (usually limited by noise or quantization).
Adapted from [reference Section 6.1].
5.1.19.2 quantization resolution — smallest possible
change in indicated value of a measurement device
(e.g., the least significant bit of a digital instrument)
5.1.19.3 imaging resolution — qualitatively, the
smallest distance between two object points that allows
them to be distinguished in an image (limited, for
example, by λ/NA in an optical microscope, beam
shape in a scanning electron microscope, or tip shape in
a scanning probe microscope).
5.1.20 self calibration (coordinate) — set of operations
that establish, under specified conditions, the
relationship between relative values of quantities
indicated by a measuring instrument or measuring
system, using self-consistency techniques as a function
of the geometry’s group of motions, or one-to-one
mappings of a feature onto itself, that preserve the
geometrical properties of features in that geometry.
NOTE 9: Self calibration is a mapping of the coordinate
system of a measuring instrument or calibration artifact to an
ideal coordinate system using self-consistency techniques
(redundant measurements of the same object in different
orientations and different positions relative to the instrument
coordinate system, including reversal techniques)[reference
Sections 6.2, 6.3], requiring only a stable artifact and
instrument. This procedure can map errors in scale linearity
and orthogonality. A length standard is still required for
calibrating the length scale of the instrument or artifact in
order to measure feature size or placement.
5.1.21 traceability — property of the result of a
measurement or the value of a standard whereby it can
be related to stated references, usually national or
international standards, through an unbroken chain of
comparisons all having stated uncertainties [reference
Section 6.1].
5.1.22 true value — value consistent with the definition
of a particular quantity [reference Section 6.1].
6 Related Documents
6.1 ISO Document
2
International vocabulary of basic and general terms in
metrology, ISO, 1993, 60 p., ISBN 92-67-01075-1.
6.2 Chris Evans and Robert Hocken, “Self-
Calibration: Reversal, Redundancy, Error Separation,
and ’Absolute Testing’”, Annals of the CIRP, vol.
45/2/1996.
6.3 Raugh, Michael R., “Two-dimensional stage self-
calibration: Role of symmetry and invariant sets of
points,” Journal of Vacuum Science Technology B
15(6), (Nov/Dec 1997)
6.4 J. Potzick, “The problem with submicrometer
linewidth standards, and a proposed solution,”
Proceedings of SPIE 26th International Symposium on
Microlithography, vol. 4344-20 (2001).
2 International Organization for Standardization, ISO Central
Secretariat, 1, rue de Varembé, Case postale 56, CH-1211 Geneva 20,
Switzerland. Telephone: 41.22.749.01.11; Fax: 41.22.733.34.30,
Website: www.iso.ch

SEMI P35-0704 © SEMI 2000, 2004 7
APPENDIX 1
SOME GENERAL NOTES ON LINEWIDTH METROLOGY
NOTICE: The material in this appendix is an official part of SEMI P35 and was approved by full letter ballot
procedures on April 22, 2004.
A1-1 A metrology process can be represented by the
operation
process model ⊕ feature model → output model.
A1-1.1 Here the process model represents the
metrology process. These models are abstractions of the
complex realities they represent, a simplification
usually required in order to make the modeling tractable
and the measurement practical. The output model of
this metrology process is the feature model (Section
5.5.4) with the metrology results attached, including the
associated measurement uncertainty. Measurement
uncertainty arises from inevitable differences between
both the process and feature models and their respective
realities. The measurement error (Section 5.10) is the
difference between the measurement result and the
unknown true value, and the measurement uncertainty
(Section 5.11) is expressed as a confidence interval
representing the variance of the measurement errors.
The measurement uncertainty includes components
from model infidelity in addition to scale calibration,
repeatability, environmental factors, etc. A confidence
interval of 95% (or 2σ for normally distributed errors)
is used in the examples, in accordance with
international custom. That is, the likelihood that the true
value of the measurand (Section 5.9) lies within the
range (measurement result ± measurement uncertainty)
is 95%.
A1-1.2 A manufacturing process can be represented in
a similar manner. In particular, if that process is wafer
exposure, then the same feature model for the
photomask features can be used for both the mask
metrology and exposure processes:
exposure model ⊕ photomask feature model
→ wafer feature model.
A1-1.3 Errors and uncertainties in the photomask
feature model propagate through the exposure model to
become manufacturing errors—differences between a
wafer feature’s size or placement and its target value—
and manufacturing uncertainties. In analogy with
measurement uncertainty, tolerances on wafer features
encompass mask measurement uncertainties, including
differences between the models and their respective
realities, as well as the effects of tolerances for
exposure parameters and photomask features. The mask
error enhancement factor (MEEF) and other optical
proximity effects are good examples of the wafer
exposure model operating on photomask feature size
and placement variations to produce nonlinear
variations in wafer feature size and placement under
some conditions.
A1-2 Real microlithographic features (Section 5.5)
often have irregular shapes and rough edges; it is
neither possible nor necessary to know the exact shape
of a feature to be measured. The purpose of the feature
bounding boxes (Section 5.1) defined here is to account
for such edge details as top-to-bottom runout and along-
the-line irregularities that are often observed. In such
cases the bounding boxes help define the measurand
(Section 5.9). To the extent that such details are not
known, not relevant, or too complex to be considered,
the bounding boxes represent the feature with a simpler
geometry and mix these disregarded details into the
measurement uncertainty. For the ideal line with known
edge geometry and no edge irregularities, the inner,
mean, and outer linewidth bounding boxes (Sections
5.8.3–5.8.5) can be identical and the line edge bounding
box (Section 5.6) can have zero width. The bounding
box approach simplifies metrology issues for the quasi-
thin-film features often encountered in
microlithography. Extension of the concept to
structures with nonplanar top surfaces or extending
below the reference plane (Section 5.14) becomes more
complicated.
A1-3 A great deal of flexibility has been incorporated
into some of these definitions. This is because the
definition of a measurand (Section 5.9) can depend on
the purpose for which a measurement is made, and the
measurement error depends on the definition of the
measurand. It is up to the user to specify or define the
measurand in a way that suits his present purpose and in
an unambiguous way. Otherwise interpretation of the
measurement result may be in error and the
measurement uncertainty may be meaningless or
impossible to ascertain. In other words, the “true
values” of feature edge positions, centerline (Section
5.3), centroid (Section 5.4), and linewidth (Section
5.8.1), can depend on the purpose to which the
corresponding measurement results are put. The
definitions given here allow for some flexibility so they