semi合集-English.pdf - 第4075页
SEMI F56-0600 © SEMI 2000 5 18 Illustrations Satisfy Manufacturers War m up Requirement s Ensure all Reference requirement s are met Purge MFC with N2 Zero MFC and record Data Vary Po sitive DC powersupply holdin g negat…

SEMI F56-0600 © SEMI 2000 4
14.2 MFC Indicated Flow:
()
100)(% ×÷= utputFullScaleOvOutputDatalowFullScaleF LL
where the output data is in Column B in data sheet. Record this result in Column G on the data sheet.
14.3
Flow Standard (actual flow):
14.3.1 Follow the manufacturer's recommendation for the flow standard output (Column C in data sheet)
conversion to percent of full-scale flow. Record this result in Column H of the data sheet.
14.4
Calculate the average value of the three data-flow points at each power level setting for the MFC indicated
flow (Column G) and the flow standard (Column H) in the data sheet. Record the averages in Columns I and J of
the data sheet, respectively.
14.5
Determine the span by subtracting the zero value (Column G or H) at a particular power supply variation
setting from the 100% flow value (Column G or H) at the same power variation setting. These span values for the
MFC and the flow standard are to be recorded in Table 2.
settingiation
p
owersamethe
H
orColumnGavg
H
orColumnGavgSpan
MMMM
MMMM
var@
).(%0).(%100
−=
14.6
Calculate the change in flow at a power supply level by subtracting the MFC indicated value (Column I) from
the flow standard value (Column J). Record these results in Column K of the data sheet. Calculate the voltage
variation from the reference voltage value as a percent change as follows:
voltage change (VC) = voltage value - reference voltage × 100
reference voltage
Record this result in Column L and M of the data sheet for the positive and negative power supplies, respectively.
15 Reporting Results
15.1 Present the data as shown in Table 2 for both zero and span.
15.2 Present the data plots for the values in Table 2 as illustrated in Figure 4.
16 Precision and Accuracy
16.1 The precision and bias of this test method will be determined during validation.
17 Related Documents
SAMA Standard PMC 31.1-1980, Generic Test Methods for the Testing and Evaluation of Process Measurement
and Control Instrumentation.
1
IEC Publication 546-1976, Methods of Evaluating the Performance of Controller with Analogue Signals for Use in
Industrial Process Control.
2
1 Portions of this method are excerpted from SAMA Standard PMC 31.1-1980 with permission of the publisher, Process Measurement and
Control Section, SAMA, 1101 16th St., N. W., Washington, DC 20036.
2 Available from the Institute of Environmental Sciences, 940 East Northwest Highway, Mount Prospect, IL 60056.
SEMI F56-0600 © SEMI 20005
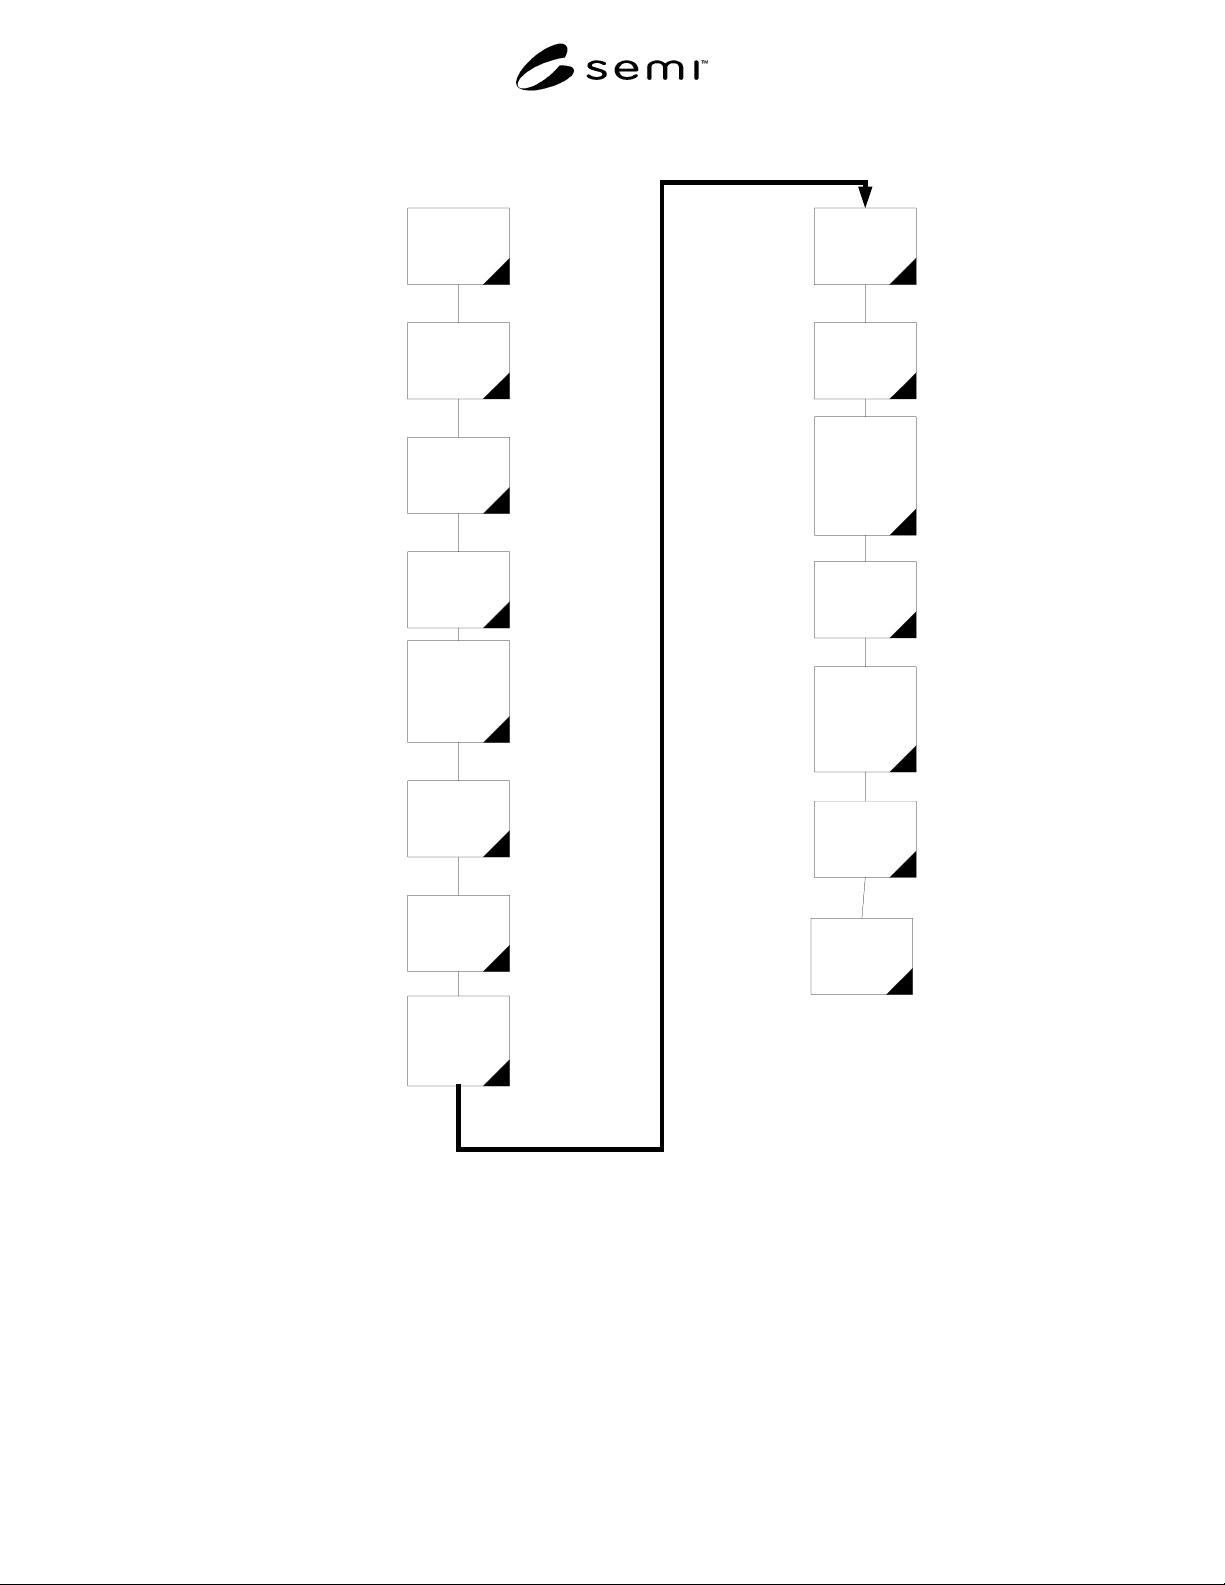
18 Illustrations
Satisfy
Manufacturers
Warm up
Requirements
Ensure all
Reference
requirements are
met
Purge MFC with
N2
Zero MFC and
record Data
Vary Positive DC
powersupply
holding negative
supply at
reference value
Record Data at
each power level
Zero MFC after
power supply limit
is reached and
record Data
Vary Negative DC
power supply
holdong positive
supply at
reference value
Record Data at
each power level
Zero MFC and
record Data
Vary both power
supplies together
and record Data
at each level of
increasing range.
Zero MFC and
record Data
Vary both power
supplies together
and record Data
at each level of
decreasing range.
Zero MFC and
record Data
Repeat 13.5 -
13.13 with MFC at
100% Flow
13.4
13.5
13.6
13.2
13.3
13.6
13.7
13.8
13.6
13.9
13.10
13.11
13.12
13.13
13.14
13.15
Figure 1
Flow Chart
SEMI F56-0600 © SEMI 2000 6
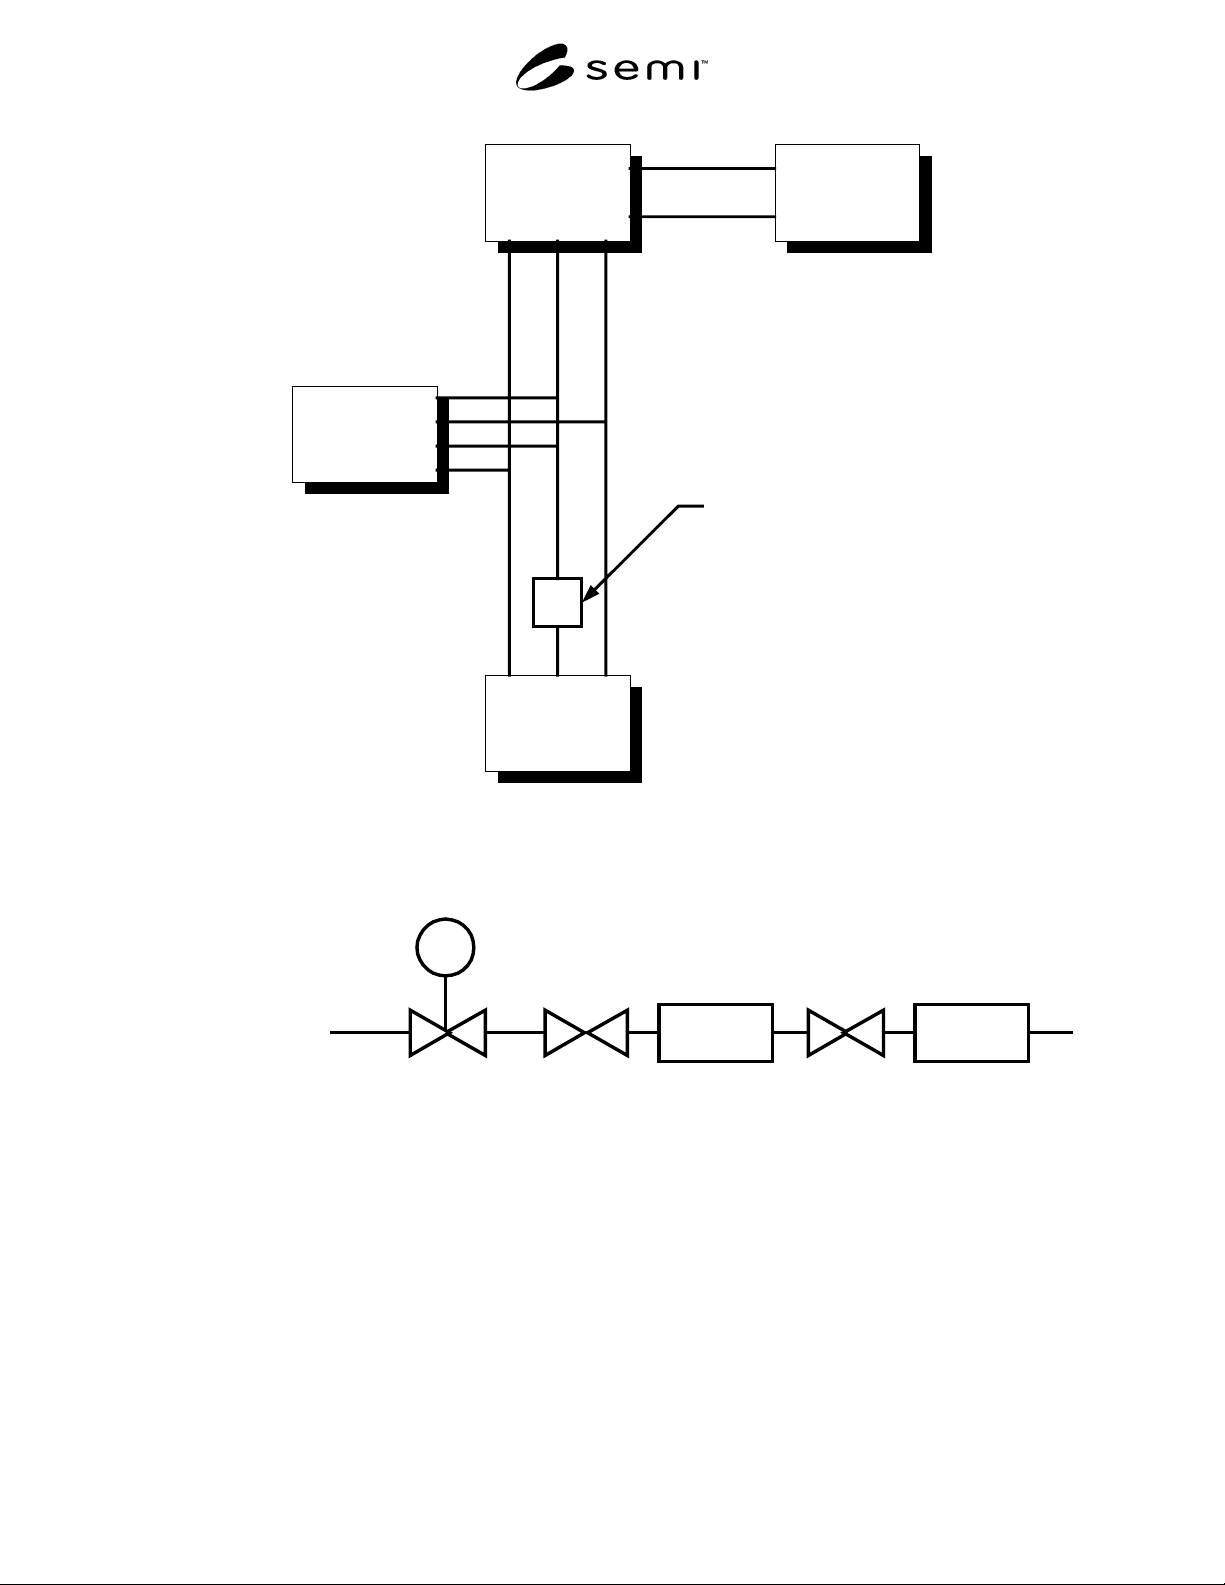
MFC
Under Test
DC Power Supply
Monitor/Recorder
DC
Power Supply
Flow Output
Monitor/Recorder
+ COM -
Current Meter
Figure 2
Test Setup for DC Supply Voltage effects
P1
MFC
FLOW
STANDARD
Pressure
Regulator
Inlet
Valve
Outlet
Valve
Nitrogen
Source
Figure 3
Flow Setup