semi合集-English.pdf - 第470页
SEMI E67-0304 © SEMI 1997, 2004 5 Figure 2 Types of Cycles 14.4 Discontinue cycling. Perform the parametric tests on all MFCs and record the results on the data sheet. If any MFC experiences a soft failure, record t h e …
SEMI E67-0304 © SEMI 1997, 2004 4
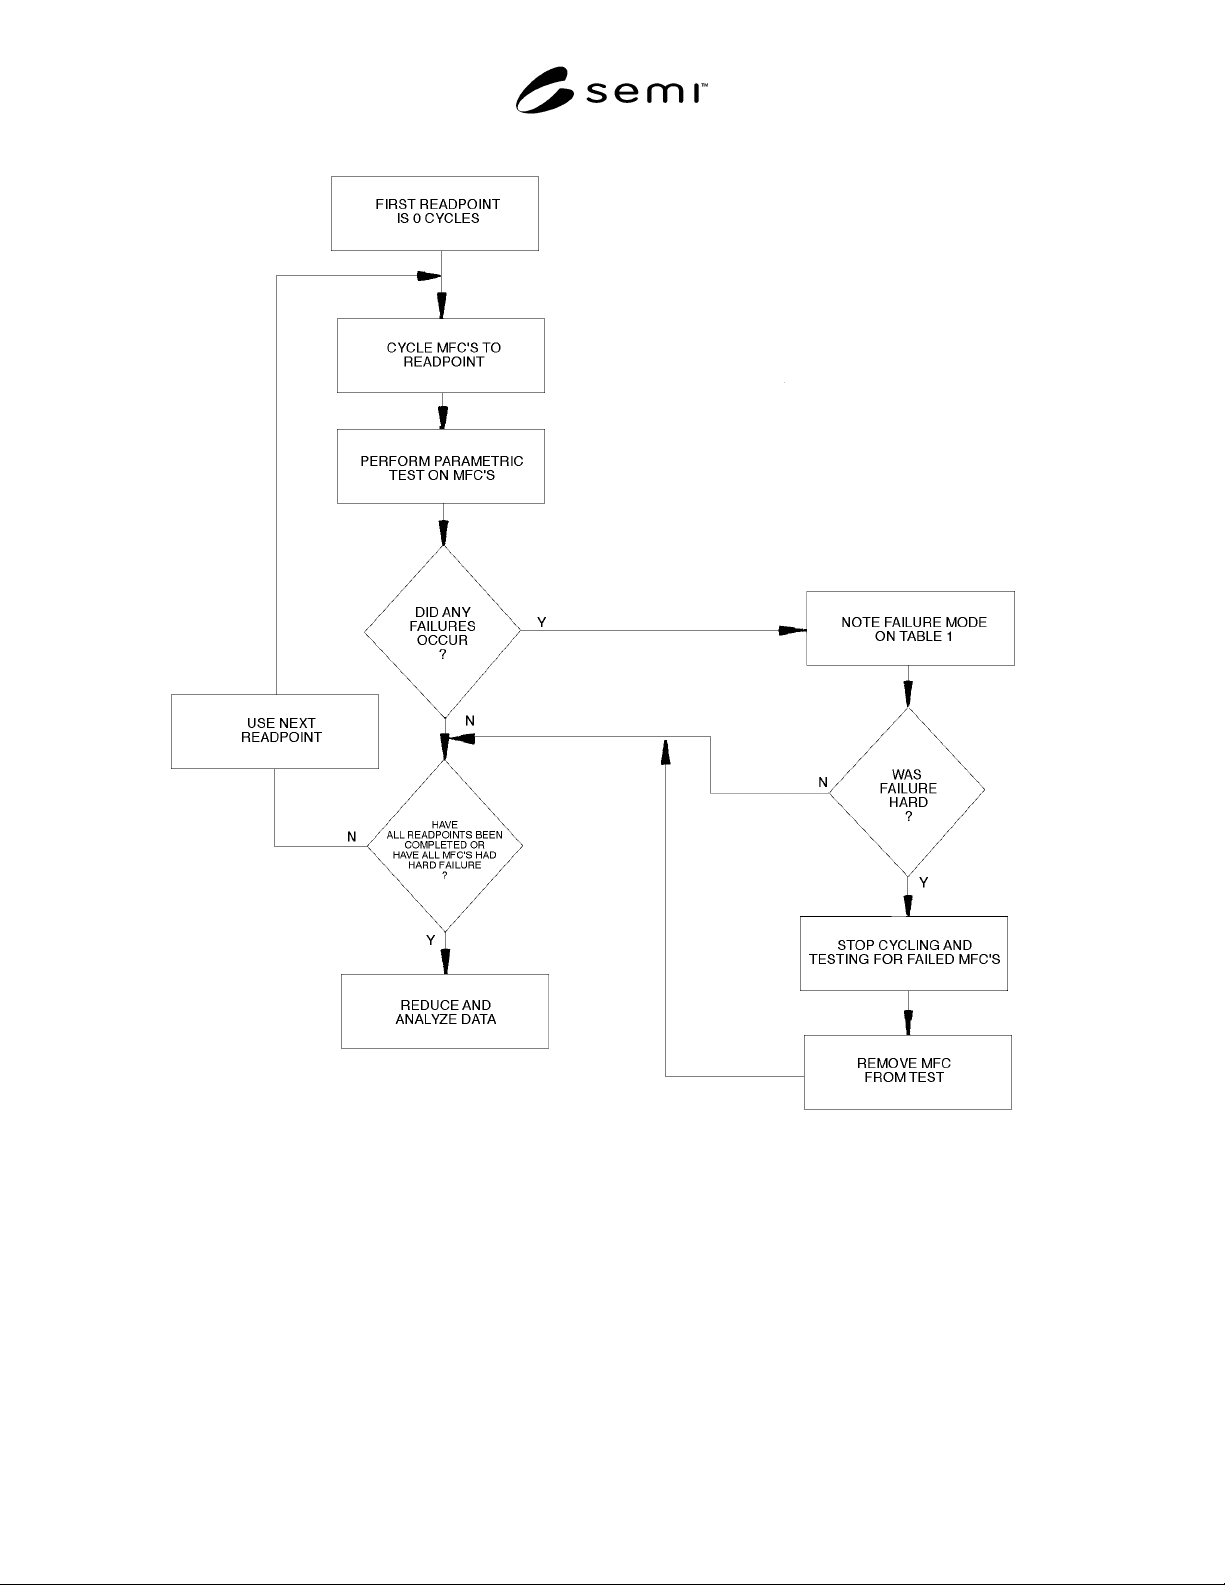
Figure 1
Flowchart for Reliability Test Procedure
NOTE: Do not count the cycles that occur during the parametric test.
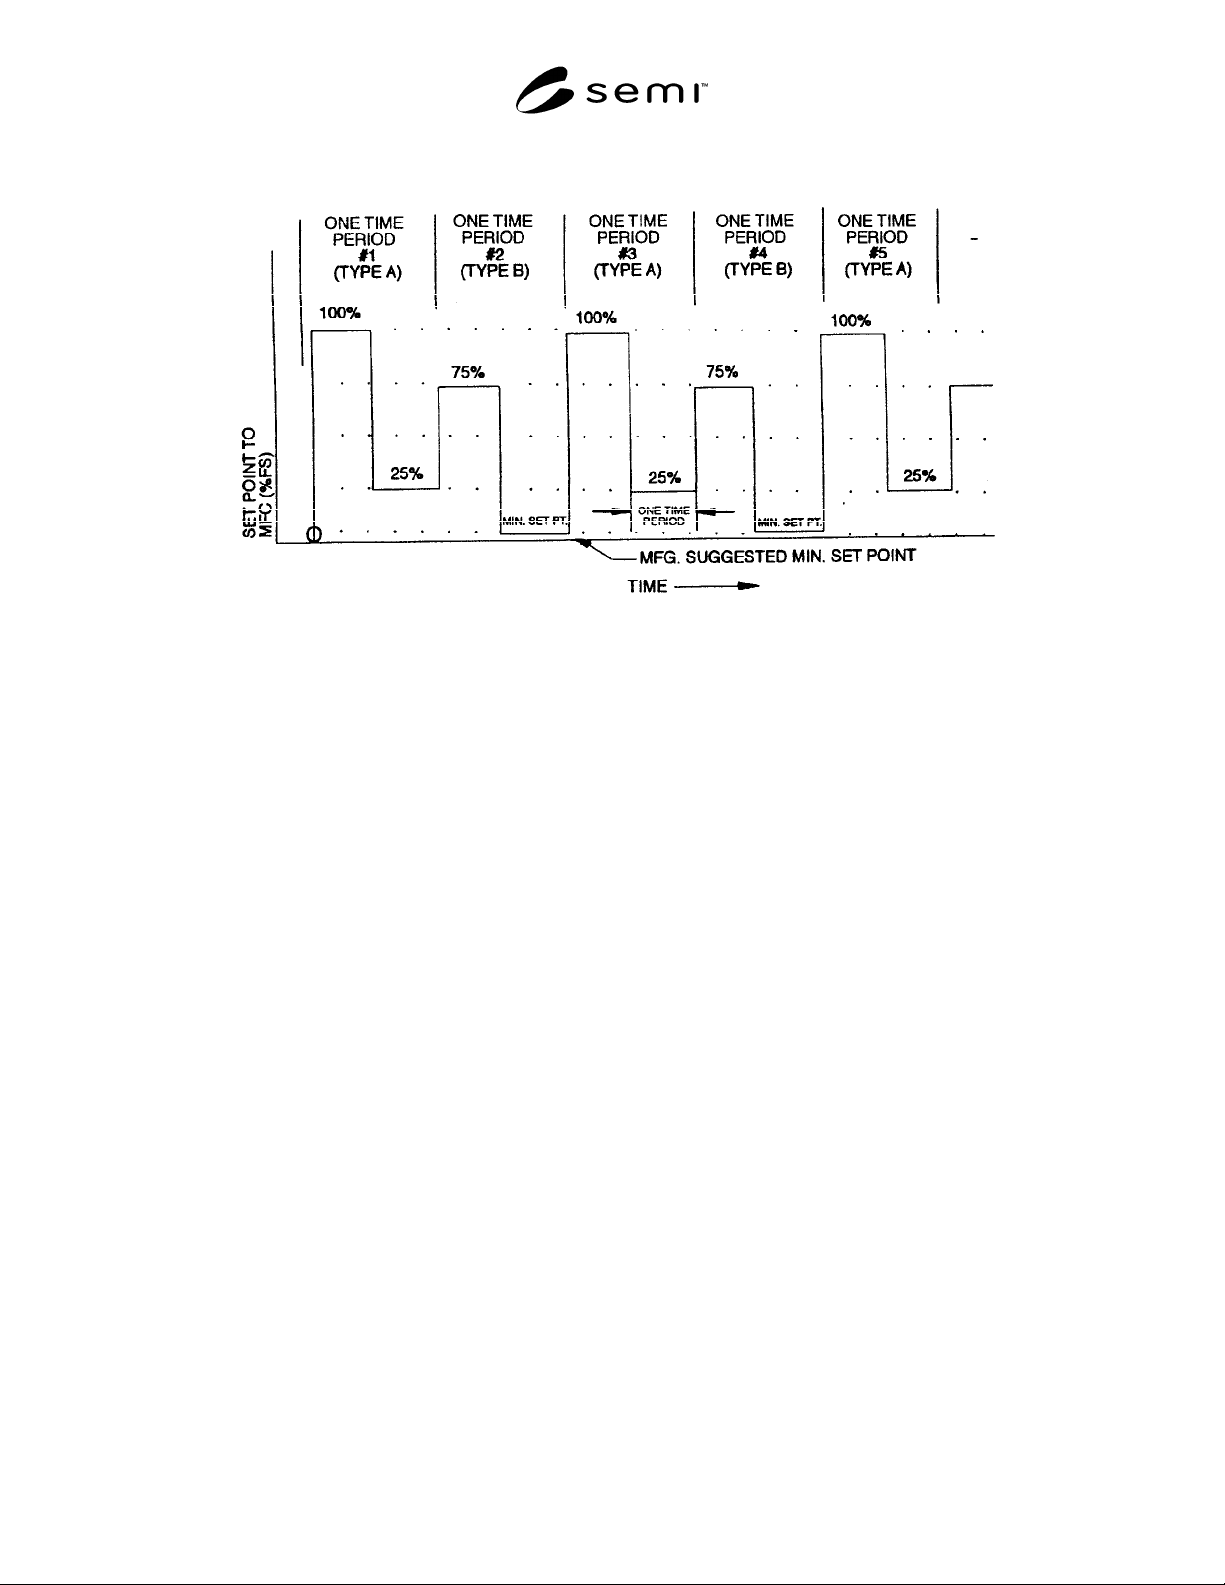
14.3 Cycle the MFCs to the next readpoint in Table 1. Two types of cycles are applied to the MFC to simulate more
realistically the MFC’s field environment. Alternate between the two types of cycles as illustrated in Figure 2.
Maintain each setpoint for a fixed period of time. Use one of the following times based upon the settling time of the
slowest DUT. If the settling time is less than or equal to 1.25 seconds, use a time period of 2.5 seconds. If the
settling time is less than or equal to 2.5 seconds and greater than 1.25 seconds, use a time period of 5 seconds. If the
settling time is greater than 2.5 seconds, use a time period of twice the settling time.
SEMI E67-0304 © SEMI 1997, 2004 5
Figure 2
Types of Cycles
14.4 Discontinue cycling. Perform the parametric tests
on all MFCs and record the results on the data sheet. If
any MFC experiences a soft failure, record the data but
do not stop the cycling procedure. However, if an MFC
experiences a hard failure, record the data, discontinue
testing this MFC, and take appropriate action to
maintain system integrity.
NOTE 2: The test does not require mention of the cause for
hard failure, as it is beyond the scope of this document.
14.5 The parametric tests should be performed in the
following order: particle, accuracy, response, and leak.
14.6 Perform all of the parametric tests on a single
MFC before proceeding to the next one. Record the
order of the MFCs tested and the time since the test
stand was idled.
14.7 If the readpoint is reached during a time when it is
not possible to start the parametric testing, continue
cycling until it is possible to begin. Record the number
of cycles that occurred before beginning testing.
14.8 Average the particle count information over a 10-
minute interval. Count particles for six 10-minute
intervals. Record the data from only the last three 10-
minute intervals.
14.9 Repeat Sections 14.4 through 14.8 until all the
readpoints have been completed or until all MFCs have
experienced hard failures.
15 Data Analysis
15.1 Calculations — See Appendix 1 for a discussion
on reliability calculation.
15.2 Interpretation of Results — The readpoints
included in Table 1 are approximately equidistant on a
log scale, and as data is collected, the number of
readpoints needed to show trends and estimate life will
decrease significantly.
16 Data Presentation
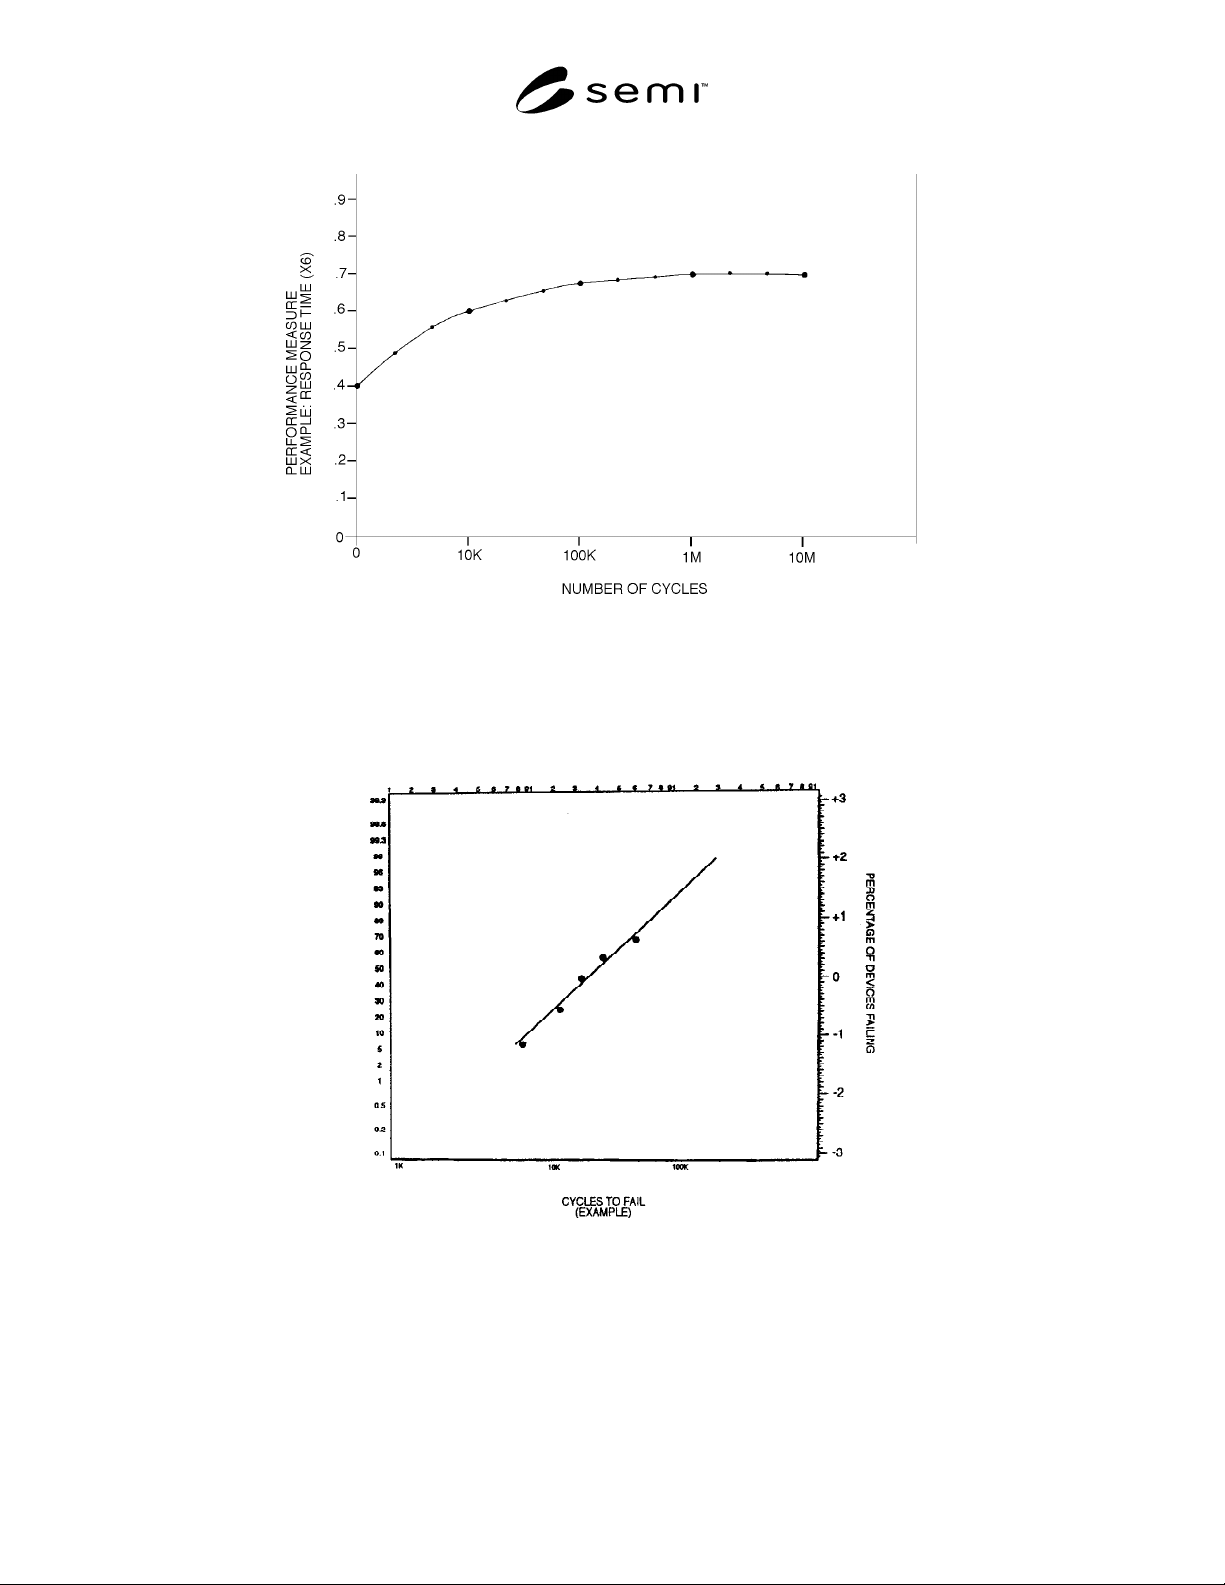
16.1 Plot each performance measure over number of
cycles to look for trends and shifts as a function of use
(see Figure 3). This gives a picture of dynamic
performance vs. use.
SEMI E67-0304 © SEMI 1997, 2004 6
Figure 3
Typical Performance Measure vs. Number of Cycles
16.2 Record time to failure and plot failure times on lognormal or Weibull probability scales (see Figure 4). This
plot gives an estimate of the useful life of an MFC (see Sections A1-1.1.4 – A1-1.1.5). Record data for the parameter
tested in the data sheet given within the parametric test method.
Figure 4
Time to Fail vs. Failure Percentage