semi合集-English.pdf - 第7551页
SEMI MF1810-0304 © SEMI 2003, 2004 4 sample. The m ethod bias is estimate d using the ave r age range of the lo cation deviations from the target for the round-robin r esults or 2.11 defects/c m 2 . 12 Keywords 12.1 defe…
SEMI MF1810-0304 © SEMI 2003, 2004 3
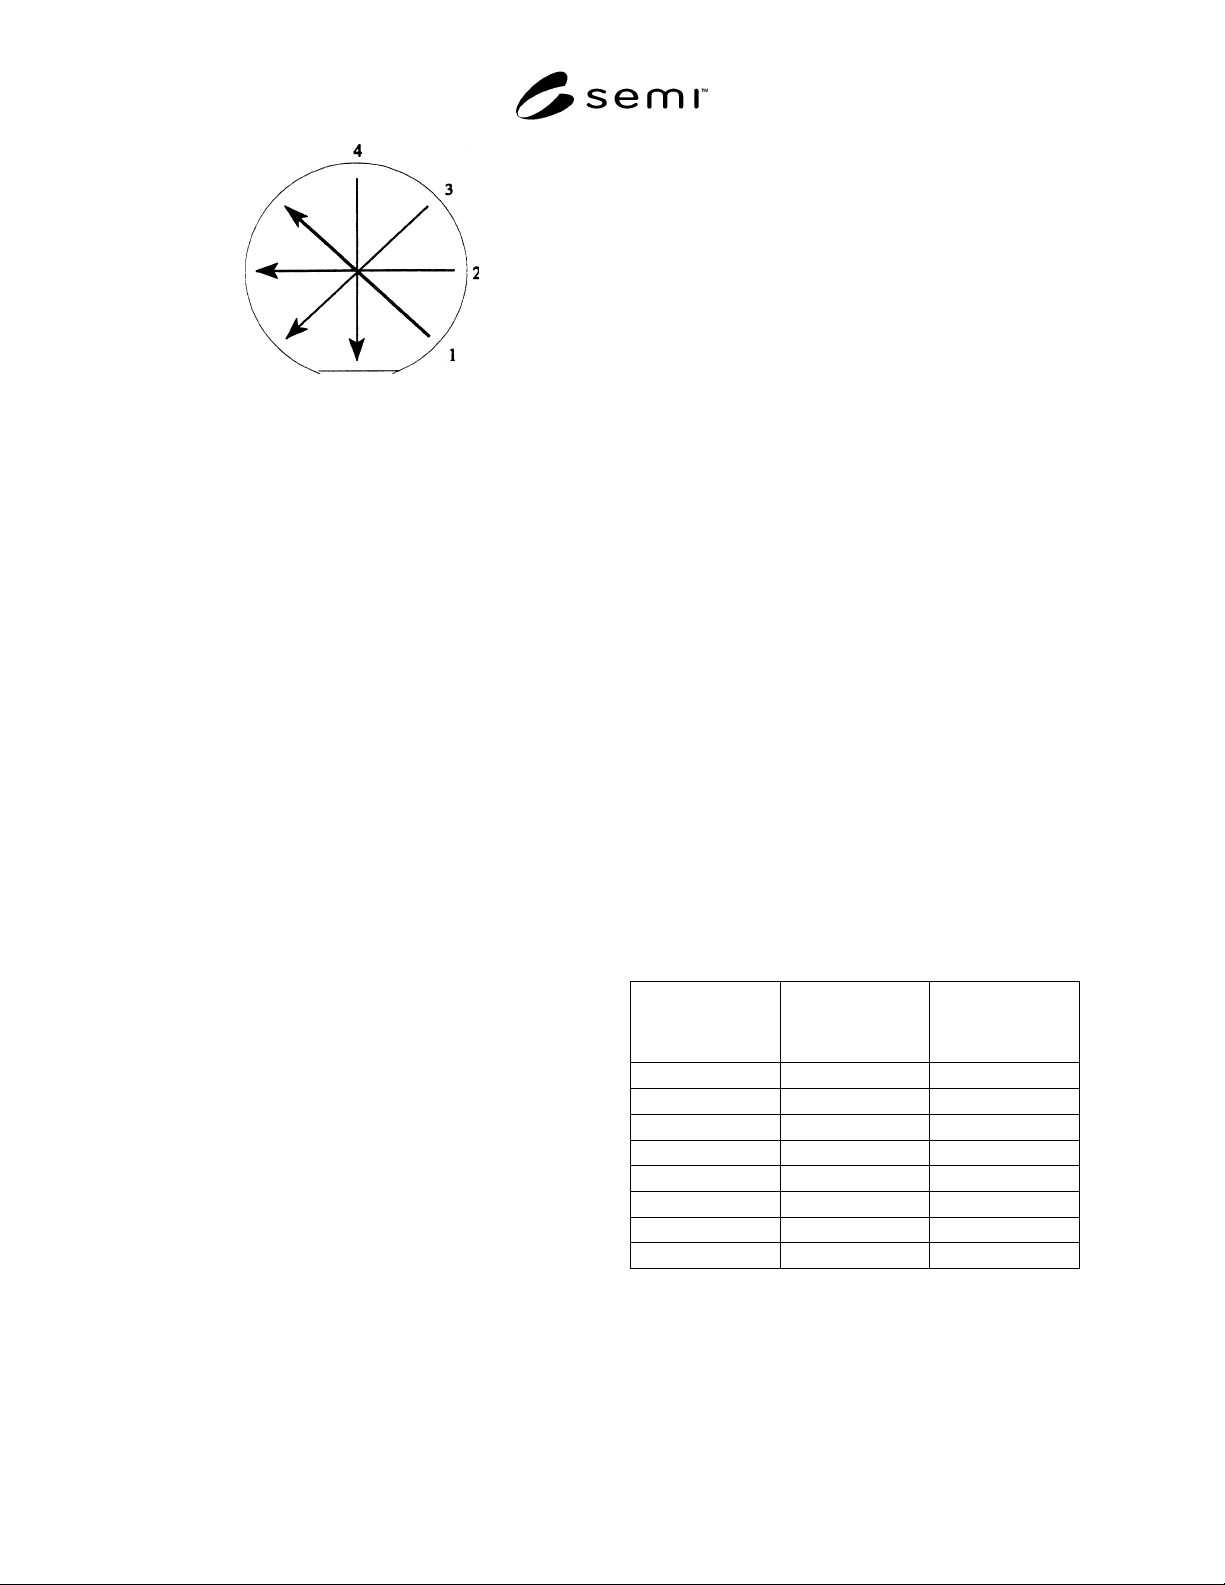
Figure 2
Four Scan, Multiple Microscopic Inspection Pattern
9.2 Defect Density Calculation
9.2.1 Count each defect class separately for each
diameter scanned. Calculate the total area inspected by
multiplying four (4) times the calibrated width of the
field of view in centimeters by the length of the scan in
centimeters. The length (L) in centimeters is the wafer
diameter (D) in centimeters minus twice the 0.5 cm
edge exclusion (E):
0.12 −=−= DEDL (1)
The density is the defect count divided by the total area.
NOTE 4: When a scan intersects a flat, notch or laser mark,
the total area must be adjusted according to the reduced length
of the affected scans. Failure to adjust the area results in
inaccuracy.
10 Report
10.1 Report the following information:
10.1.1 Date of test, laboratory and operator,
10.1.2 Identification of the specimen wafer,
conductivity type, orientation, and diameter,
10.1.3 Specimen history; thermal cycle, preferential
etchant formulation, thickness removal during
preferential etching,
10.1.4 Inspection conditions; magnification, and total
area inspected, and
10.1.5 Defect density and precision by defect
classification.
11 Precision and Bias
11.1 Precision — The multi laboratory precision of
this test method was established through a round-robin
experiment. Seven (7) wafers with randomly
distributed oxidation induced stacking faults (OISFs)
were analyzed by sixteen (16) laboratories over eleven
(11) diameter scans. Repeatability and reproducibility
of this test method were calculated using two sets of
four scan measurements from each laboratory and
wafer. The wafer samples were prepared according to
SEMI MF1727 and etched with Wright Etch in
accordance with SEMI MF1809.
11.1.1 Repeatability — The method repeatability is
equal to 2.8 times the within-laboratory standard
deviation or 5.22 defects/cm
2
. Repeatability contributes
23.81% of the total variation. The variability of the
measurement is sample dependent; assumptions of
random OISF location were described as a limitation
(see Section 3.3).
11.1.2 Reproducibility — The method reproducibility
is equal to 2.8 times the between-laboratory standard
deviation or 9.31 defects/cm
2
. Reproducibility
contributes 75.73% of the total variation.
NOTE 5: Additional analysis is presented in Related
Information 1. A study of two repetitions of this test method
was extracted from the existing, multiple scan data measured
at each laboratory.
11.1.3 The wafers exhibited single diameter scans that
ranged from 0 to 13 defects/cm
2
while the grand
average of all measurements for each wafer yielded
densities of 0.21 to 3.60 defects/cm
2
. The range in
measurement density is related to differences between
laboratories and local variation of the defect density on
the wafer itself.
11.1.4 Ten separate diameters were measured on each
of 7 wafers by 16 laboratories. The total number of
scans for each sample was 160. Table 1 shows the
sample dependence of the results with the standard
deviation versus mean OISF count for ten independent
scans.
Table 1 Ten Scan Inspection Data
Wafer Identity
Standard
Deviation
Mean OISF
Density All Data
(OISF/cm
2
)
A 0.49 0.21
B 1.79 1.43
C 1.93 1.98
D 1.02 0.82
E 2.51 3.60
F 0.63 0.42
G 0.71 0.51
ALL 1.49 1.28
11.2 Bias — No standard reference materials are
available to calibrate this measurement; therefore a
target density for each wafer was assigned by averaging
the combined data from all scans of each wafer.
Analysis of the round robin is based upon the individual
deviation from the target for each measurement and

SEMI MF1810-0304 © SEMI 2003, 2004 4
sample. The method bias is estimated using the average
range of the location deviations from the target for the
round-robin results or 2.11 defects/cm
2
.
12 Keywords
12.1 defect density; dislocation; grain boundary;
microscopic; polycrystalline imperfection; preferential
etch; silicon; slip
SEMI MF1810-0304 © SEMI 2003, 2004 5
RELATED INFORMATION 1
SUMMARY OF MULTI LABORATORY ROUND ROBIN TEST
NOTICE: This related information is not an official part of SEMI MF1810. It was developed as part of
the development of the document. This related information was approved for publication by full letter
ballot on December 4, 2004.
R1-1 The multilaboratory round robin test was done
over a period of 12 months and included 16
laboratories. The test required each laboratory to
complete 11 diameter scan measurements of seven
wafers. A “diameter scan” area is equal to the area
defined by a microscope field of view and a length
equal to the wafer diameter less the edge exclusion.
Only one defect classification, OISF, was included in
the count and described with pictures. The sequence
and path of the measurement scans were defined so that
the comparison of the individual measurements would
be possible among data sets. Within the ability of each
laboratory to align the sample on the microscope stage,
the starting point and scan path was held constant.
R1-2 The complete repeatability and reproducibility
study results are listed in Table R1-1 for the four scan
method for the parameter, deviation from target, in
units of defects/cm
2
. The average range was 2.107 and
the range of x-bars was 12.130.
Table R1-1 Repeatability and Reproducibility for 16
Laboratories, Seven Samples, and Two Trials
Estimated
Sigma
Estimated
Variance
Percent of
Total
Repeatability 1.863 3.472 23.92
Reproducibility 3.323 11.045 76.08
Repeatability and
Reproducibility
3.810 14.517 100.00
R1-3 A multiple range test by the 95% least squares
deviation (LSD) method for the deviation from target
by laboratory was done. Results are shown in Table
R1-2. Differences among laboratories are also evident
in the 95% confidence interval box and whisker plot
provided in Figure R1-1, which shows the deviation
from target for each laboratory. This plot is based on
four diameter scans per test.
R1-4 Results from Laboratory F were significantly
different from all other laboratories, but were included
in the reported Precision and Bias Section because no
evidence pointed to a procedural mistake. The
alternative repeatability and reproducibility study
results are listed in Table R1-3 for the four scan method
for the parameter, deviation from target, in units of
defects/cm
2
. In this case, the average range was 1.930
and the range of x-bars was 7.018.
Table R1-2 Multiple Range Test for 16 Laboratories
Laboratory Count
Least
Squares
Mean
Homogeneous
Groups
H 77 –0.948022 X
C 77 –0.948002 X
A 77 –0.868478 XX
O 77 –0.635124 XXX
M 77 –0.469934 XX
J 77 –0.437819 X
I 77 –0.28686 XX
L 77 –0.261265 XX
N 77 0.064319 XX
P 77 0.176689 XX
B 77 0.403837 XX
E 77 0.406758 XX
K 77 0.425747 XXX
D 77 0.549704 XX
G 77 0.816097 X
F 77 2.01237 X
Table R1-3 Repeatability and Reproducibility for 16
Laboratories, Seven Samples, and Two Trials
Estimated
Sigma
Estimated
Variance
Percent of
Total
Repeatability 1.707 2.912 44.08
Reproducibility 1.922 3.695 55.92
Repeatability and
Reproducibility
2.570 6.607 100.00